[UMG, WMG] record labels and the music industry: opportunities and challenges
Posted By
scuttleblurb
On
In
SAMPLE POSTS,[SPOT] Spotify,[UMG] Universal Music,[WMG] Warner Music |
1 Comment
I.
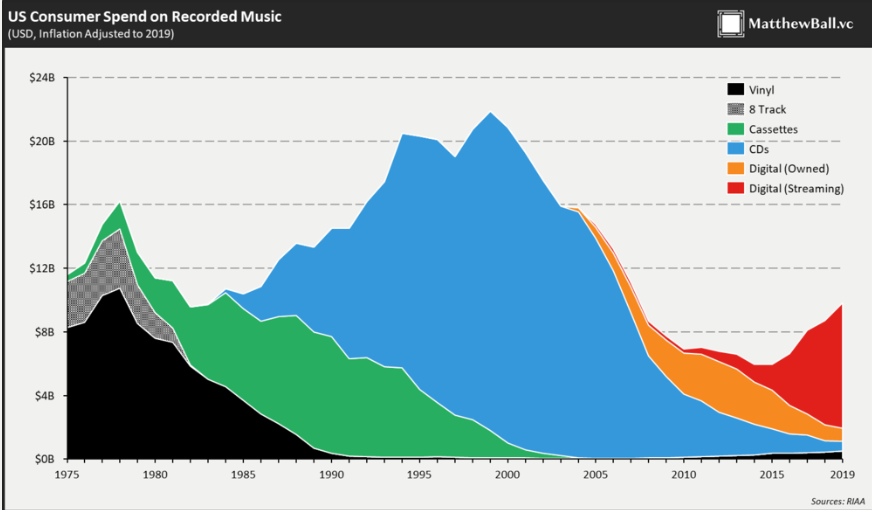
Every few years, this graphic from the Recording Industry Association of America (RIAA), reproduced by Matthew Ball, makes the rounds:
It shows how a 15-year decline in recorded music revenue, precipitated by the cannibalistic effect of free downloads, is being reversed by the rise of subscription fees from digital streaming providers (DSPs). As I detailed in my Spotify/Sirius post[1] from 3 years ago:
See that peak in the chart of recorded music sales below? That’s what it looks like when an oligopoly controls the point of scarcity and bundles tracks together in an album, forcing consumers to pay for the songs they don’t want in order to get the songs that they do. This gave way to a period where tracks were disaggregated from CDs, encoded into mp3’s, and distributed for free on file sharing services like Napster. Given how profitable CD albums were, you will not be surprised to learn that the labels summarily rejected the opportunity to license copy-resistant mp3 technology years before Napster was launched (and then they later refused to partner with Napster). And you’ll notice in the above exhibit that during the 2-to-3 year period after Napster launched but before the ubiquity of portable players allowed consumers to carry mp3s with them, Napster may have actually facilitated discovery and boosted CD sales. But the portable players caught up and the labels, whose production and distribution efficiencies were constrained by the limits of the physical world, proved no match for the network effects and the zero marginal distribution costs of Napster’s P2P model.
Harrowing declines in album sales finally forced the record labels to unbundle CDs. Through iTunes, they offered individual tracks, which hewed more closely to consumer needs than albums but still did not capture variations in a song’s long-term appeal since every track was priced at 99c regardless of how many times it was subsequently played. Per-stream pricing, where the artist/label is paid every time her song is played, is now supplanting owned tracks. Each transition, from album to owned track to streaming, more closely aligns payment with song popularity.
By consolidating and curating the world’s music, Spotify did what record label lawyers and the US court system never could: they made music worth paying for again. For a growing number of consumers, subscribing to Spotify for ~$10/month provided more value than pirating tracks for free. A minor contribution 10 years ago, digital – which includes payments from DSPs like Spotify as well as emerging platforms like TikTok and Roblox – now accounts for between ~60% and 70% of Universal, Sony, and Warner’s recorded music revenue.
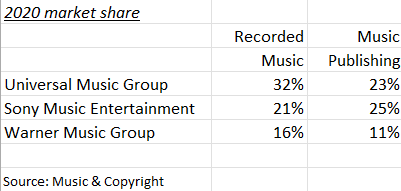
But while the way music is consumed has transformed over the last 10 years, industry profits are still largely captured by the big 3, who following their acquisitions of Polygram, BMG, and EMI, now command nearly 70% and 60% of recorded music and music publishing revenue, respectively:
The incumbents may trade a few points of share from one year to next depending on which artist is topping the charts. Also, independent labels are chipping away at the periphery (more on this). But for the most part the industry operates as a stable oligopoly.
II.
Every music recording carries two separate ownership rights: one covering an artist’s original recording (“Masters”) which falls under the labels’ recorded music segment; the other protecting the songwriting (lyrics and musical composition), which falls under publishing.
The recorded music segment, which comprises around 83% of Universal and Warner’s profits, is in the business of discovering and signing artists who they hope will grow into mega stars like Drake and Taylor Swift. They front capital (”advances”) to promising artists and remit anywhere between 15% and 25%+ of revenue (”royalties”)1[2] to them, with the high end of that range reserved for stars with bargaining power. Royalties are recoupable, meaning that they are paid to the artist only after the record company has recouped its advance.
Just making up numbers here, let’s say Spotify does $1bn of subscription revenue this month. Around 52% of that ($520mn) goes to a royalty pot reserved for Masters rightsholders (the record labels). Assuming Universal accounts for 30% of Spotify streams2[3], they are entitled to 30% of the pot (30% x $520mn = $156mn)3[4].
A top-tier artist who makes up, say, 5% of Universal’s steams on Spotify, will have $7.8mn (5% x $156mn) allocated to its Masters. At a 20% royalty rate, the artist earns $1.6mn (20% x $7.8mn). For CDs and digital downloads, the 20% royalty is applied to the wholesale price of every album sold, so if 200k CDs are sold at a wholesale price of $7, the artist will earn $280k (20% x $7 x 200k). Artists also share in the payments Universal gets for songs played by non-interactive streaming programmers (like Pandora and iHeart Radio, who choose the songs their user hears) and satellite radio providers (Sirius XM) – where rates are set by law and royalties are collected and paid by SoundExchange, a non-profit rights management organization – not to mention TV shows, commercials, motion pictures, and “emerging” platforms like TikTok, YouTube, Roblox, Peloton, etc., which we’ll ignore here4[5].
The artist doesn’t actually receive any of the royalties she earns until Universal has recouped not only its advance but also the cost of recording, ad campaigns, tour equipment, etc., some of which can be negotiated depending on the importance of the artist (most recording contracts today are structured as “funds”, where the artist receives an advance plus a fixed sum to cover recording costs). So assuming a $3mn advance, the artist will still be unrecouped by $1.2mn ($3mn – $280k – $1.6mn) in the above example.
Some analogize record advances to loans, but that’s not exactly right since if the artist flops they are under no obligation to repay. And in fact, failure is the norm. The vast majority of artists do not recoup their advance. That a handful of successful artists compensate for the failure of many many others is sometimes why the artist & repertoire (A&R) business (that is, the business of finding and developing talent) is sometimes compared to venture capital. And like sophisticated venture capitalists, the major record labels are extremely savvy about contract language and have over generations conjured all sorts of ways to minimize risk. Among other measures, most contracts contain cross-collateralization provisions, which means any royalties earned on your second album will first go towards covering deficits on the first, and so on. They also impose a ceiling on advances for subsequent albums5[6] and diversify revenue streams through 360 deals that take a cut on gross proceeds the artist realizes from acting, touring, sponsorships, and other activities. Furthermore, traditional record deals stipulate that after committing to 1 or 2 albums, the label is granted options for another 4 or 5, so they can exercise each incremental option while the artist is hot and cut bait otherwise.
In staking risk capital to develop artists, record labels have decade+ rights to or outright own the Masters, entitling them to long-term annuity-like earnings streams. It’s unlikely that a label generates much of a return in the initial 2-3 year frontline window, where the label is spending significant resources to break a new artist. After that initial investment period, however, when the track moves into catalog, a recorded track’s cash flows can be milked with very little incremental promotion (Sony isn’t putting nearly the same amount of money promoting the Beatles as they are a newer artist). You might think of frontline A&R as a low-margin feeder into catalog, where the real money is made. Catalog music makes up maybe 50% of a major label’s revenue but 70% of its profits6[7]. Universal reported that catalog (3+ years) contributed 58% of its digital and physical recording revenue last year. Not only do the catalogs of major labels make up the bulk of recording profits, they represent a key source of power. According to MRC data from Billboard[8], catalog (18+ months) music accounted for 75% of music consumption in 2021, up from 66% in 2020. The vast majority is owned by Universal, Sony, and Warner. A music steaming service doesn’t work without catalogs from all three.
The other meaningful business segment for the major labels, comprising around ~16% of segment profits, is publishing. A publisher is to songwriters what a record label is to artists: they license song compositions and lyrics to programmers and share the resulting revenue. So when Spotify streams a song, they pay two sets of royalties that sum to around 70% of subscription revenue: one to the recording rights owner, who gets ~52%, and another to publishers and songwriters, who together take another ~15%. Unlike the recorded music segment, which lays out VC-style risk capital to popularize artists, publishers are tasked with the safer, less capital intensive role of administering song copyrights (securing licenses, collecting money, and paying writers). Their cash flows largely piggyback on the investment put in by record labels.
And whereas record labels strike direct bespoke agreements with each programmer that are re-negotiated every 2-3 years, the royalty rates earned by publishers and songwriters are for the most part mandated by statute. That’s because song reproductions in physical and digital formats are covered by a compulsory mechanical license7[9], meaning that under the Copyright Act the rights owner must license the song to anyone who wants it. In addition to mechanical licenses, songs are also protected by public performance rights, meaning any radio station, streaming service, nightclub, etc. that plays a song needs the rightsholder’s permission, which they obtain through a blanket license administered by Performing Rights Societies (aka “Performing Rights Organizations”), who keep track of all the places the music is played using methods that we don’t need to get into here.
In the US, the 3 major PROs are ASCAP, BMI, and SESAC. Publishers will license all their songs to these entities, who turn around and license the songs of all the publishers they represent to users (streaming services, radio stations, etc.) in exchange for a fixed fee that can vary from hundreds of dollars to millions depending on the size of that user’s audience. After subtracting their operating expenses, PROs distribute half the remaining funds to writers (the “writer’s share”) and the other half to publishers (”publisher’s share”). Typically, the publisher will then pay half their share to the songwriter, who thereby ultimately ends up with 75% of the total PRO distributions (50% + 1/2 x 50%)8[10]. Mechanical licenses are issued in the US by the Harry Fox Agency, who takes 11.5% of the associated fees it collects (though some larger publishers, enabled by technology that makes it easier to administer licenses, are reaching deals directly with licensees). HFA passes these fees to the publisher, who in turn passes half to the songwriter.
(you might wonder whether streams and digital downloads, which can be categorized as either public performances or song reproductions, are governed by mechanical or performance licenses, which impacts how artists are paid. In many European countries, downloads are 25/75 performance/mechanical and interactive streaming is 75/25; in the US, interactive streaming is mechanical but the publisher is paid under a complex formula whereby the DSP pays 15% of subscription revenue (a rate set by the Copyright Royalty Board), part of which is allocated to the performance license fee (for reporting purposes, Universal and Warner break out “digital” as a line item that is separate from mechanical, which for reporting purposes only covers only physical media).)
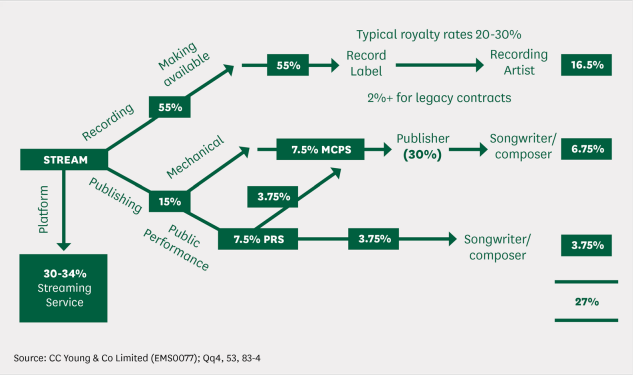
The labyrinthine division of a DSP subscription dollar is summarized below (the percentages below apply to the UK and differ somewhat from the US-biased percentages I used in my examples above):
Using my numbers, it looks like a dollar of subscription revenue realized by an interactive DSP roughly breaks down like this:
Record Label: 44c
Publisher: 6c
DSP: 33c
Artist: 8c
Songwriter(s): 8c
(the numbers don’t add up to $1 due to leakage from PRO and HFA fees)
So around half of every streaming dollar is paid to recording and publishing rightsholders who, in the case of the 3 majors, are housed under the same roof.
Note how the flow of funds in publishing differs from recording. Whereas in recording the labels collect all the money from the DSP and distribute royalties to artists, in publishing the money is intermediated by third parties, with the exception of songs used in TV shows, movies, and commercials, which are covered by direct synchronization (or “sync”) licenses between publisher and programmer.
(before I get “ackshually”-ied, let me state the obvious: for the sake of simplicity, I’m skipping over lots of contingencies and nuances. Revenue share differs by media and geography, and the bargaining power of the various parties involved can alter the distribution of earnings rather significantly. If you are interested in the gritty details, I highly recommend reading Donald Passman’s All You Need to Know About The Music Business, which is where I pulled many of my numbers.)
III.
The bull case for Universal and Warner is easy enough to understand. They own or license exclusive rights to a pool of IP whose value continues to appreciate in value as its presence in our lives becomes ever more ubiquitous. With recorded music consumption shifting from physical sales and downloads to digital streams, music is being monetized as predictable and recurring revenue rather than as one-off sales, in much the same way enterprise software is purchased as SaaS subscriptions rather than perpetual licenses. And whereas the SaaS migration came with a gross margin trade-off for software vendors, the transition to digital music delivers a margin lift for the record labels, who no longer bear the costs of manufacturing and distributing CDs.
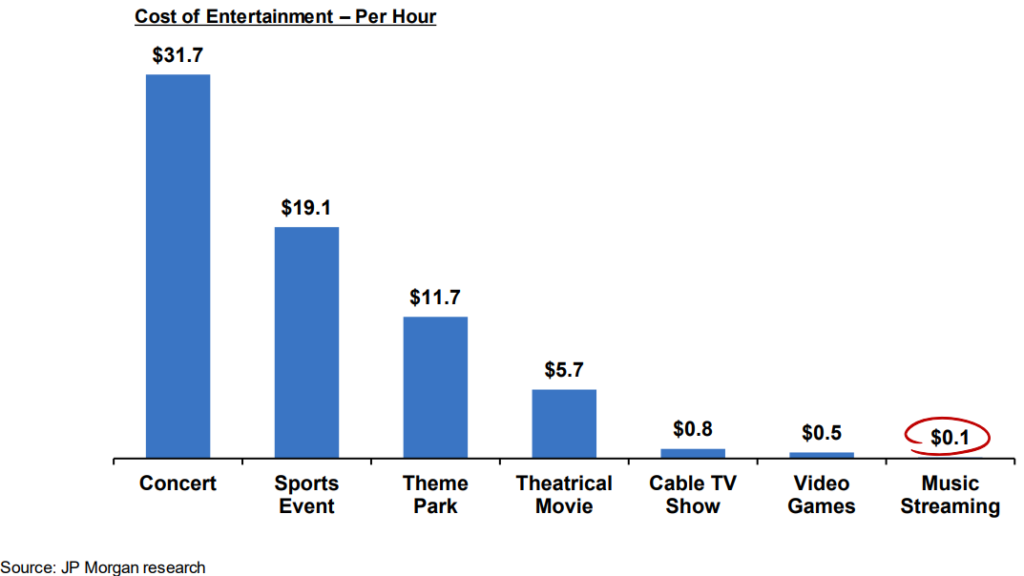
Goldman Sachs sees worldwide streaming subscriptions growing by 10%/year to 1.3bn9[12]. Pershing Square, who owns 10% of Universal, expects more like 14%. In either case, most of the growth will be fueled by emerging markets (Spotify reports 32% MAU/TAM penetration in established markets compared to just 8% in in emerging), where ARPUs are substantially lower (Spotify’s Premium ARPU has declined by around 6%/year since 2016 due to this mix shift). Some of that dilution should be offset by ARPU gains in developed markets, as music remains very under-monetized compared to other forms of entertainment:
Source: Pershing Square presentation
At the 1999 peak of recorded music revenue, the average CD buyer spent around $45 a year on music10[13], so maybe 30 to 40 songs across 3 CDs? Today, a Spotify subscriber pays less than 3x as much for ~70mn tracks, the same as a Rhapsody subscriber paid for 5mn songs[14] in 2008.
In addition to streaming platforms, music is being woven into all kinds of once inconceivable use cases. In the mid-2000s, the labels were partnering with mobile providers to capitalize on ringtones; today, they supply the background soundtrack to Peloton classes, Roblox scenes, and TikTok challenges. Warner’s revenue from these emerging applications have more than tripled over the last 2 years and account for 7% of its recorded music business. Warner, Sony, and Universal sit are both toll booths sitting between artists and the hundreds of digital platforms through which fans access their music.
The big 3 occupy this privileged position because they control most of the rights to the industry’s catalogs, which comprise nearly 3/4 of US streams. This speaks to a unique property of songs: as 3-5 minute snippets of sound that concurrently augment other activities, they are played over and over again. Movies and TV shows, which require more time and dedicated attention are, on the other hand, typically watched just once or twice. Spotify, Apple Music, and Amazon Music can’t differentiate on unique content the way Netflix, HBO, and Hulu might, nor can they source from a fragmented base of owners. Imagine subscribing to a platform that doesn’t carry Taylor Swift, Drake, or The Beatles. It’s a non-starter. A streaming service that doesn’t license the catalogs of all 3 majors is no streaming service at all.
IV.
So on the surface, Universal and Warner check the classic compounder boxes – they are oligopolists in a growing end market with stable demand, monetizing long duration assets as recurring earnings streams with few reinvestment requirements. But some of the factors that have catalyzed the industry’s renaissance also give rise to new challenges.
With technology and social media making it easier to directly reach fans, bargaining power is shifting from the record labels to artists, who are negotiating higher royalties and advances while reducing the number of optionable albums. The deal used to be that in return for assuming the risk of promoting new talent, record labels could bank on owning recording rights into perpetuity. But it’s become more common for artists to own the recording rights and lease them to record labels, as in the case of agreements struck with Drake, Taylor Swift, and Jorja Smith (as Prince once put it[15], “If you don’t own your masters, your master owns you”). In some cases Masters are returning to artists within 10 years. On the publishing side, rather than grant partial control of copyrights to publishers and split the earnings 75/25 under co-publishing agreements, it is becoming more common for songwriters to own the compositions entirely while paying publishers a 10%-15% administrative fee to manage licenses and collect royalties.
To what extent does label sponsorship contribute to stardom? Do record labels turn artists into superstars or do they merely glom rising talent? In the analog days, the answer was cut and dry. Teams of A&R men with honed intuition would scour local clubs and review submissions from managers to discover unknown artists and feed promising talent through labels’ massive distribution machines. As I wrote in my Sirius/Spotify post:
They steered which songs were played in radio stations and controlled distribution by colluding with major retailers like Musicland and Tower Records. In owning production, discovery, and distribution – costly functions that could not be independently undertaken by artists – record labels functioned as kingmakers for a select few, leaving a long tail of artists who toiled in obscurity, with no way of getting their music in front of fans.
But high quality DIY recording tools and free online distribution have obviated some of gatekeeping functions once played by record labels. Billie Eilish and Jorja Smith got their start uploading tracks on SoundCloud. Stormzy came up by posting freestyle raps on YouTube. Lil Nas X’s “Old Town Road” blew up on TikTok before hitting Billboard charts.
TikTok has blossomed into a major discovery engine. By now we’ve all seen the TikTok of 420doggface208 posted skateboarding with a bottle of Ocean Spray Cran-Raspberry juice in hand, lip-syncing to Fleetwood Mac’s “Dreams”, a sensational viral moment that catapulted this 1977 hit to the Rolling Stone Top 100 and led to a surge in digital downloads and streams of the song [16]within days of the post. Music Journalist Elias Leight remarked “TikTok is like a machine gun shooting out viral songs even more than daily”. But TikTok’s influence on the music industry goes beyond one-off cultural moments. Here is a 2021 study from Vox[17] that details how TikTok virality can change the long-term trajectory of a musician’s career. Of the 125 unestablished artists who went viral on TikTok after January 202011[18], 46% went on to sign with a major record label, and of the 367 artists who landed their first record deal, 1/3 cited a viral moment on TikTok as the catalyst.
Nearly every one of the 125 TikTok artists with a viral hit saw a corresponding spike of streams on Spotify (the “TikTok-to-Spotify” pipeline), and almost all then saw their other tracks included on editorial playlists. Of the 332 unestablished artists who made Spotify Top 20 Chart after January 2020, 1/4 caught their big break on TikTok. An artist who goes viral on TikTok is very likely to be approached by every major label, which can lead to a frenzy of bidding activity that results in far more favorable royalty and licensing terms than DIY artists could negotiate 10 years ago. The major labels will insist that their relationships with hundreds digital platforms yield data advantages that can be used to plan tours and guide marketing, but to collect data across online properties they are often relying on third party tools like Chartmetric and Instrumental that are used by other labels and managers. Also, when it comes to discovery I question value of platform relationships as the tracks being discovered originate from viral moments generated by a handful of services – a track goes viral on TikTok before percolating across the hundreds of other DSPs – whose public data everyone more or less has equal access to.
For a flat subscription fee, DistroKid (which raised money at a $1.3bn valuation in Aug 2021), CD Baby, and Believe Digital (slash TuneCore) will distribute across TikTok, YouTube, Spotify, Apple Music, etc.; track streams and downloads; and even collect money for independent artists without taking a cut (CD Baby will even press vinyl records). There are also independent labels who will distribute for a much lower cut of revenue than full service majors while charging separate fees for other services like marketing and promotion. MiDIA Research[19] reports that the major labels continue to lose a bit of share (~30 to 100bps) to independents and self-releasing artists every year. And while the big 3 plus Merlin (who represents hundreds of large independents) still account for 78% of streams on Spotify, this is down from 87% in 2017. Music, like other creative pursuits, has and always will generate a disproportionate share of revenue from a small percent of artists, but the distribution isn’t as skewed as it was in the 1990s12[20], when literally the only way to get in front of a big audience was to be sponsored by a major label.
I don’t think this is such a big deal though as the incumbents have long operated independent label subsidiaries, with Sony Music’s recent $430mn acquisition of AWAL a salient accent on their long-standing practice of rolling up competitors. Universal, Sony, and Warner are often thought of as monolithic entities, but it’s more accurate to think of them as holding companies for a bunch of genre and region-specific labels. Besides maybe some differences in genre mix and leadership (Universal’s Lucian Grainge is a legendary A&R talent while Warner’s Stephen Cooper is more of a nuts-and-bolts financial guy), they all basically have the same operational setup, compete vigorously for the same artists, and fast follow each others’ strategies.
And for all the anecdata about artists throwing it back in labels’ faces, mega-stars, who you’d think would be in the best position to disintermediate labels, continue to depend on them. Taylor Swift famously re-recorded and released covers of her first 5 albums to devalue her original Masters, which came to be owned by Ithaca Holdings, whose founder/CEO Scoot Braun was publicly called out by Taylor as a “bully”, before being sold to private equity. This re-recording gambit was so successful, with the new covers outperforming the originals, that in recent contracts Universal Music has been “effectively doubling the amount of time that the contracts restrict an artist from rerecording their work[21]”. But though Swift – an 11-time Grammy winning dynamo with 183mn Instagram followers – now owns her Masters, she relies on Universal-owned Republic Records to promote and distribute her work. And after gaining organic traction, Billie Eilish signed with Darkroom/Interscope (owned by Universal), Jorja Smith with Sony/ATV, Lil Nas X with Columbia Records (Sony Music) and Stormzy with Atlantic (Warner Music). I don’t think there is a single top 50 artist that isn’t represented by a major record label, either through long-term licensing terms, during which most of the IP value is extracted, or outright copyright ownership.
I’m reminded of this anecdote relayed by Arman Gokgol-Kline, a partner at Ruane, Cunniff & Goldfarb in his Business Breakdowns interview[22]:
I spoke to a professor at Berkeley College of Music, which one of creme-de-la-creme music schools in the country, about various aspects of this business. And one of my favorite stories he told me is every year I ask my students to raise their hand when I say to them, “Who likes labels and wants to work with a label?” And nobody raises their hand. And then he says, “Okay, now imagine one of the major labels comes to you and gives you an upfront and wants to sign you. Who would sign on with them?” And everyone raises their hand.
At the end of the day, every musician dreams of stardom and getting there takes more than mere integrations with DSPs. There are 60k tracks uploaded to Spotify every day. How does an artist stand out? The major record labels may no longer have as tight a grip on discovery, but through large advances, promotion, and creative support; relationships with radio stations, movie studios, and global distributors; and the market share to exert soft influence on streaming services to promote their artists, they in a better position than anyone to supercharge talent that has broken out of obscurity. Labels can provide a menu of services tailored to the varying needs of stardom-bound talent, with mid-tier artists availing themselves of short-term distribution deals with independent subsidiaries before then graduating to full record deals as they become more popular.
For the few artists who do manage to become superstars, often the best way to capitalize on popularity is through live concerts. From Business Insider[23]:
Consider, for example, U2[24], which made $54.4 million and was the highest-paid musical act of the year in 2017, according to Billboard[25]‘s annual Money Makers report. Of their total earnings, about 95%, or $52 million, came from touring, while less than 4% came from streaming and album sales. Garth Brooks (who came in second on the list), owed about 89% of his earnings to touring, while Metallica (ranked third) raked in 71% of their earnings in the same way.
The labels take a healthy cut of streaming revenue but they also raise a superstar’s profile, which helps maximize the value of live appearances.
V.
While record labels are best characterized as service businesses, those services are preceded by up front advances, and the capital requirements have gotten bulkier as competition for publishing catalogs has intensified.
As I mentioned earlier, whereas the revenue split between recorded music rightsholders and the programmers who license those rights are individually negotiated and determined by the relative bargaining power of the two parties, the share of revenue paid by licensees to publishers and songwriters is set by the CRB. While the CRB’s rate rulings can seem unfair to whichever party finds itself on the wrong side of them – to the consternation of DSPs like Spotify, a 2018 CRB ruling raised the payouts on mechanical streaming from 10.5% to 15.1%[26]13[27] – it seems they also come with concessions so that no side decisively wins. And so, because payout terms are set by law rather than by unpredictable market forces and because cash flows largely ride on the investment that record labels put in to popularize artists, publishing is seen as a very long-lived14[28] and low-variance annuity.
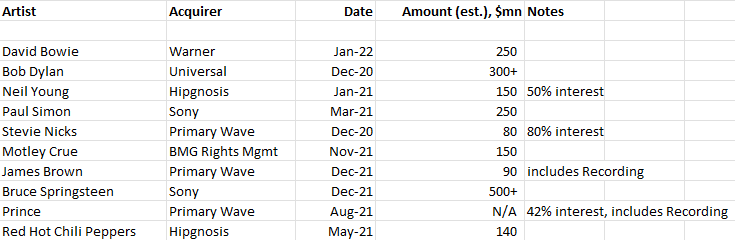
The last 5 years have seen heightening bidding for song catalogs, with much of this activity fueled by financial buyers. Last October, Blackstone partnered with Hipgnosis Song Management[29] (a music IP investment company), providing $1bn of funds. The same month, Apollo backed HarbourView Equity Partners[30] with $1bn. In February, KKR and Dundee Partners acquired a catalog from Kobalt Capital (which includes songs from the Weeknd and Lorde, among others) for $1.1bn and securitized the portfolio of rights. Last June, Oaktree Capital invested $375mn[31] in independent publisher Primary Wave. A few months after acquiring a majority stake in the publishing and recorded music rights of OneRepublic and the band’s lead vocalist and songwriter Ryan Tedder, valued at $200mn, KKR announced a joint venture with former portfolio company BMG[32], which has since acquired more than 250k copyrights from more than 1k artists and songwriters, including Billy Idol and ZZ Top. This JV is similar to a partnership that Providence Equity Partners struck with Warner Music in 2019.
Here is a sample of some notable catalog acquisitions over the last 1.5 years, some of which include other IP rights besides:
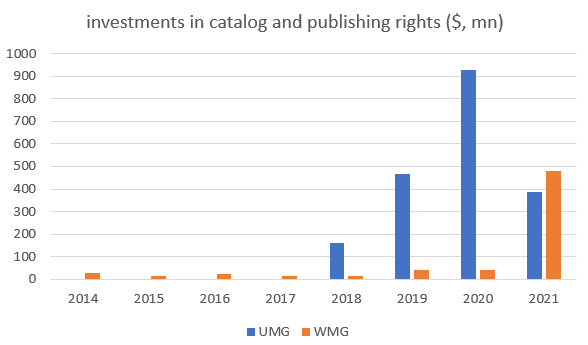
Since its 2018 IPO, Hipgnosis has spent $2bn on IP rights. Warner and Universal have followed suit, investing more in catalogs than they have in years:
(Warner’s fiscal year ends September)
All this frenzied biding has driven deal multiples from a historic valuation of 8x-12x net publisher’s share [34](revenue minus royalties paid to songwriters) to 25x-30x, raising understandable bubble concerns. The enthusiasm is especially concerning to investors because this is the entertainment industry, where creative egos loom large and vanity and empire building often trump financial considerations. On earnings calls and annual reports, Universal and Warner will, with puffed chests, brag about the marquee catalogs they’ve acquired and how many of Top 10 artists they represent (Warner Music has none of the Billboard top 10; they’re doing just fine), while offering no details whatsoever on deal terms or the returns they expect to earn on those investments. With more market share, labels can exert influence on streaming platforms and perhaps also signal credibility to new promising talent – “if a 360 deal with Universal is good enough for Drake, it’s good enough for me” – but separate from those commercial factors, it also confers bragging rights.
A more charitable take on this phenomenon is that the economics of streaming make up for higher deal multiples. I mean, sure, 10-15 years ago catalogs were being sold at 10x, but with the industry crushed by piracy and no proven business model in sight, their earnings streams were also subject to a lot more risk. Moreover, in the 2000 peak, nearly all recorded music revenue came from CDs that were sold in stores, whose shelves could not accommodate a popular artist from 20 years ago. In the streaming era, all the music is available all the time, so one might argue that the useful life of content is longer than it used to be and, when paired with a user-generated content engine like TikTok, is also more discoverable. 420doggface208 skateboards to “Dreams” and a rock band from the ‘70s is resuscitated back into relevance.
Also, the major labels can do more with publishing assets than private equity can. When financial players buy music catalogs, most of the time they are just interested in passively milking bond-like cash flows and levering them up to hit return bogeys. They might do a somewhat better job administering publishing assets better than the previous owner, but I doubt there’s much incremental return from that. Universal, Sony, and Warner, on the other hand, are operators who often own or license the rights to both the publishing catalog and catalog’s associated recordings, which gives them more flexibility to grow and maintain song catalogs by pursuing sync deals with movie studios and licensing arrangements with fitness, gaming and social media apps, or creating biopics, music films (like Rocketman and Bohemian Rhapsody), remixes, and other derivative fare, all of which requires the okay of both the recording and publishing rightsholders. So although they are paying double or triple what they used to for catalogs and accepting somewhat worse commercial terms from artists, the labels might still nonetheless realize more value on a risk adjusted basis than they did in the past. I don’t know that that’s true, but it seems plausible?
I’m eyeballing things a bit as disclosure isn’t great, but the returns on content (EBITA / gross content assets) in Warner and Universal’s publishing businesses look close to respectable at around 9% to 12%. The recording side, comprising over 80% of profits for both companies, has enjoyed phenomenal returns – Warner’s recording segment assets have grown ~$700mn from fy16 to fy20 while EBITA is up ~$500mn; Universal’s recording content assets + goodwill have grown by €1.3bn from 2018 to 2021 while EBITA is up maybe €700mn over that time – which makes sense given the streaming tailwinds and the fact that the majority of recording profits come from catalogs that don’t require much incremental investment.
The management teams at Universal and Warner pinky swear that they’re focused on returns and now both companies have public investors holding them to that promise. Their business models seem to be less about high variance artist discovery and development than about making more assured, educated financial bets on things that seem to be working, whether that means signing record deals with breakout TikTok sensations or acquiring song catalogs with demonstrated longevity. The increasing speed with which tracks mushroom into popularity (”TikTok-to-Spotify” pipeline) may accelerate the recoupment of advances and improve IRRs. Anecdotal concerns that artist royalties are growing more generous and that whatever cost savings realized in the shift from physical to digital will be offset by higher promotion costs aren’t apparent in the numbers – as a % of recording revenue, Warner’s A&R costs have declined since fy16. Warner and Universal have enjoyed consistent EBITDA margin expansion in recent years.15[35]
But what about the next 5 or 10 years? That the pool of recorded music revenue will continue to expand as music pervades more digital experiences seems like a pretty safe bet, but an industry structure characterized by concentrated pockets of power in different parts of the value chain – superstar artists, record labels, and digital steamers – puts some checks on surplus accrual. The degree to which new modes of discovery and consumption have neutralized the value proposition of the major labels and the power they wield in the music ecosystem, has up to now been more than offset by the radical turnaround in industry prospects that those modes have enabled. I don’t think the big 3 face material existential risk, as they effectively control the key ingredients to every viable streaming service and signing with them is still the best way for a superstar to reach the widest audience. Still, it wouldn’t surprise me to see the combined squeeze of higher artist royalties, a mix shift from full service to modular arrangements, and unfavorable commercial agreements with Spotify hinder margin expansion plans.
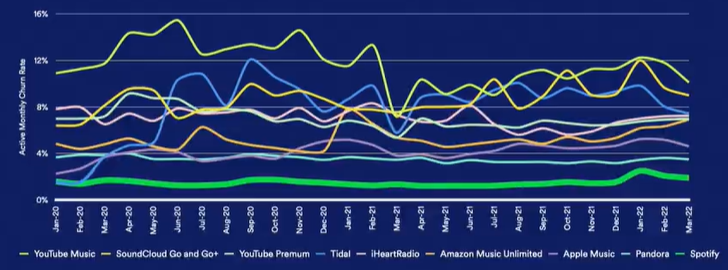
Remember when Spotify bulls looked to Netflix as an aspirational comp? By paying fixed sums for content, Netflix could drop most of the incremental revenue to EBITDA and wouldn’t it be great if Spotify could do that too instead of passing 70c of every subscription dollar to rights owners. But one of the downsides to video streaming is that it requires differentiated content, which puts streamers on a never-ending spend treadmill to retain existing subs and acquire new ones. In music, because every streaming platform must license all the songs from all the majors to be even minimally viable, the basis of competition shifts from content to user experience. A consumer has no reason to switch from Spotify to Apple or Amazon to access original content since they all carry the same stuff, so they opt for whoever provides the best curation and build personalized playlists on that service, locking themselves in over time:
Source: Spotify Investor Day Presentation (Jun 2022)
Benedict Evans has this line about how all the questions that matter for Netflix are about Hollywood, not technology. But in music streaming, where content is a shared commodity, technology drives differentiation.
Streaming music isn’t such a great business in isolation but it creates a captive base on which Spotify can layer low marginal cost revenue streams. The idea that Spotify could leverage its users to disintermediate labels was a popular bear thesis for Warner 3 years ago. But investors have come to see that the game theory of mutual assured destruction prevents either party from bypassing the other (a streaming service isn’t competitive without labels’ catalogs and artists won’t put up with a label that doesn’t distribute on the market leading streaming service). I think this is the right take. But that doesn’t mean Spotify can’t extract value from the labels in other ways. For instance, with all the first party engagement data they have on an audience that is primed to discover new tracks, Spotify has spun up a marketplace that labels can use to promote their artists’ music to new fans. Rather than attempt to disintermediate labels or fight for greater share of subscription revenue, Spotify can grab margin by charging them for access to its subscriber base. Wary of tying their fortunes to a single, ever dominant platform and keenly aware that marketing can be an easy stream acquisition tool when used by one player but an industry tax when used by all, the labels might be reluctant to spend too heavily on Spotify. But they all care about stream share and it only takes one defector to break the dam. There are signs of traction. Marketplace revenue has grown from €20mn to €160mn in just 3 years and has been the primary driver of Spotify’s music gross margin gains.
Podcasting is the other hopeful money maker. Since getting into podcasts in 2018, Spotify has spent $1bn on content, with just $200mn of annual revenue and enormous losses to show for it. But while podcast industry ad revenue is a small ($2bn) ,it is growing rapidly (500%+ since 2018) industry and with Original and Exclusive content representing a disproportionate share of the Top 100 podcasts on its service, Spotify is taking share. So management thinks that by growing ad revenue on a largely fixed cost base they can eventually get podcasting gross margins to 40%-50% (vs. 27% for the overall company today). Podcasting, like music, is audio but the useful life of content is shorter and the business model has more in common with video streaming, where content is once again a vector of differentiation and the usual perpetual inflated bidding concerns apply. But augmenting music with exclusive podcast content should better retain existing users and also draw new ones, some of whom will convert to Premium subscribers, emboldening Spotify to demand a greater share of revenue. Of course, the matter of who has more bargaining isn’t specific to Spotify but pertains to any service that commands a massive audience, including (no, especially) TikTok, where discovery plays such a central role and I imagine labels’ mature catalogs have far less value. Though then again, the labels will argue that they are getting a growing share of revenue from emerging channels like social media, fitness tech, and gaming, making them less reliant on Spotify. I don’t have a strong intuition about who will find themselves in a better position to demand better economics 5-10 years from now.
Owning the consumer relationships gives Spotify options on new sources of value creation (podcasts, audiobooks, NFTs??), but getting those options in the money means spending boatloads to acquire subscribers and content. The music labels more or less just free ride off that. While Spotify YOLOs into new TAM, their 3 largest suppliers clip low variance cash flows.
The labels pitch themselves as tech savvy, forward looking operators with a firm pulse on the trends. But let’s be real. When P2P sharing heaved the industry into existential crisis, the best the incumbent labels could do was fight back with lawsuits. It fell upon Apple and then Spotify to push the industry to its current profitable equilibrium. That’s not to say the record labels aren’t more attentive to new ways of capitalizing on talent (with all monumental changes over the last 10 years, how could you not?) but for the most part I see them as gold mines of IP protected by sharp legal teams, managed by A&R folks whose art for discovering talent is increasingly subsumed by the technicalities of scrapping engagement data that is concentrated in a handful of streaming platforms. This isn’t necessarily a bad thing! That the big 3 absorb most of the industry’s profits despite contributing the least to its innovation tempo is maybe the most compelling testimony of how durable their legacy advantages may be. It’s hard for me to gain that much conviction in any single consumer facing app that monetizes through fickle and scare attention (Netflix isn’t just competing against linear TV but Fortnite, TikTok, Instagram, etc. TikTok was born just 5 years ago and today has Facebook quaking in fear). The record labels are a safer bet that whatever the next big social experience turns out to be, music will play an important role.
Disclosure: At the time this report was posted, accounts managed by Compound Insight LLC owned shares of AMZN. This may have changed at any time since.
scuttleblurb 2024 content review
Posted By
scuttleblurb
On
In
SAMPLE POSTS |
No Comments
Happy holidays everyone,
This post will kick off an annual tradition where I provide brief summaries of blog posts published during the year. As always, I’ll discuss my thoughts on the business of scuttleblurb in my annual interview with LibertyRPF[36]. Most of the text in the summaries below is extracted directly from the write-ups and all commentary reflects my views at the time they were written. These summaries in no way do justice to the actual posts. They are meant to be teasers that I hope will convert some free subs into paying subs and encourage paying subs to take a second look posts they may have passed over for lack of immediate interest. This will be the last post of 2024. I will begin the new year with writeups on AppFolio and Maravai.
A few other announcements:
First, on a personal note, I recently launched a gofundme for Boulder Crest Foundation[37] in honor of my brother, Rich, a veteran of the Iraq and Afghanistan wars who struggled with combat stress for many years before taking his own life this past March. Boulder Crest has helped more than 100,000 veterans, servicemembers, and first responders transform their struggle with trauma into strength. Their Warrior PATHH[38] program includes a 7-day in-person initiation retreat, followed by 90 days of dedicated support and accountability. It is offered to participants at no cost. Please join me in supporting the brave men and women who have made enormous sacrifices on our behalf. To those of you who have already donated, I am incredibly grateful. So far, we’ve raised more than $36k (including my match contribution), blowing past the original $10k goal.
Third, I’m excited to announce that MBI[41] and I launched a podcast, where we casually chat about companies we’ve written-up once a month. The first episode is a discussion on AppFolio (Spotify[42], Apple[43], RSS feed[44]). MBI writes a terrific blog[45] and if you aren’t already a subscriber, well, you should consider becoming one!
Finally, thank you all so much for the support and feedback you’ve given me over the years. It is a joy and privilege to write this blog for you. See you in the new year!
On the differences in serial acquisition programs, from [AME] AMETEK[46]
“As a serial acquirer grows, so too does the amount of M&A required to move the needle. But because, as a general rule, the larger the deal size the loftier the valuation, it’s not just how much capital gets deployed that matters but over how many acquisitions.
….Vertical market software disaggregates across countless pockets, but software is alike enough that you might treat VMS as a giant, homogenous mass. Constellation can do 100+ deals a year because the playbook applied to running a software business that sells to restaurants also mostly applies to running a software business that sells to spas or auto repair shops. Constellation Software is less a bet on technology or product or even end market than it is a bet on a system for efficiently researching and acquiring small software companies at scale, and the more companies they buy the larger the database against which to hone base rates on future acquisitions.
So my point is: when the angle to M&A is less about technical sophistication than it is offering a permanent home for sellers plus superior execution against a sticky customer base, the particulars of product and end market seem almost beside the point. Competent managers with pride of P&L ownership, supported by the right incentives to drive value, are the critical drivers.
Teledyne is governed by a different dynamic. They do in fact acquire for differentiated technology, technology that tends to be concentrated in just a handful of companies, companies that become increasingly scarce as they become big enough to absorb the growing sums of capital that Teledyne needs to deploy every year. Also, Teledyne doesn’t want technology that is too far outside their existing competencies, which further limits where they can hunt. These constraints force them to accept lower returns as they put more capital to work. So unlike Constellation, Teledyne has deployed larger amounts of capital by buying bigger, not more.”
“…while BFS’ share repurchases are optically accretive (”share count go down”), they are extremely concentrated during periods when share prices are elevated. Why? Because BFS returns cash to shareholders when they have lots of it to spare, which happens to coincide with cyclical peaks, which also happens to be when the stock is soaring.
Buybacks = dividends. That’s Finance 101. Management can repurchase shares or pay a dividend to shareholders, who use that cash to buy shares themselves. No value is lost or gained. Same-same. But that equivalency assumes that the company is no better at repurchasing its own shares than shareholders themselves.
Buybacks generally fall into two buckets:
opportunistic: management has a better sense than shareholders do of whether their company trades at less than intrinsic value per share. They can buy their stock better than shareholders can. In this case, repurchases are preferable to special dividends paid to shareholders.
programmatic: management uses cash flow to buy shares, without any assessment of intrinsic value. The cash comes in, they turn around and buy shares with it. Assuming cash flows are reasonably stable from one year to the next, management will find itself sometimes buying stock when it is cheap (below IV) and sometimes when it is not. The company has no better or worse sense than shareholders of when the stock is cheap or expensive, so it makes no difference whether they repurchase shares or shareholders buy shares with dividends they receive from the company.
An investor would prefer 1) over 2), but 2) isn’t necessarily value destructive so long as cash flows are somewhat consistent from one year to the next and intrinsic value grows at a reasonably measured pace. An analogy here would be an investor who auto-invests her steady paycheck in an equity ETF without any regard to valuation or market timing. Some of those purchases will turn out poorly, others great, but on balance things should turn out all right so long as the diverse collection of businesses constituting the ETF create value over time.
But now imagine a business that implements a programmatic buyback butalso generates the vast majority of its cash at cyclical peaks. A special dividend would be better in those cases because even an investor who uses that dividend to buy more shares but does so at random will outperform management, who systematically invests at the top and at no other point.”
Garbage collection and disposal is one of the few businesses that you can be sure will still be around in 20 years. Its recurring necessity gives rise to predictable and stable cash flows. Residential collections are locked in under 3 to 10 year exclusive agreements that are very hard to lose, as city officials don’t want to risk pissing off voters by re-bidding contracts, a lengthy and onerous process that could disrupt garbage pickup. Commercial (retailers, restaurants) and Industrial (manufacturers, contractors) customers are secured under 3-5 year contracts that are tough to profitably steal away from incumbents who have established route density (the more customers a collector has along its route, the more cost effectively it can serve an incremental customer). They will accept hike prices without much resistance because trash collection is a necessary but small enough[49] component of their overall operating costs.
In its May ‘22 Investor Day, GFL projected C$1bn of free cash flow by 2024, a target that they were soon forced to walk back after being hit with soaring fuel costs and interest expense (~28% of its debt floats). These headwinds would prove manageable. Throughout 2023, management recovered underlying margins by pushing through fuel surcharges and higher base rates, and improved the balance sheet by using proceeds from the sale of certain non-core assets. But even absent the divestiture, with GFL pricing 100bps+ above cost inflation, I can see EBITDA growing by 8%/year, outpacing the 6% growth in cash interest expense and bringing leverage in line with a best in-class peer like WCN. Including incremental profits from renewable natural gas and Extended Producer Responsibility (EPR) fees takes free cash flow to C$1bn by 2025, growing to C$1.3bn by 2027, which capitalized at 25x implied a mid-teens return. In short, I see this as a low brain damage stock with a credible path to mid/high-teens returns so long as GFL manages the business responsibly and pushes prices above cost inflation. The harrowing economic climate of the last few years offered sound evidence that they can do just that.
Uniforming employees is an important but non-core activity. For safety and presentation reasons, healthcare professionals need to be outfitted with clean scrubs, electricians with flame-resistant gear, used car salesmen with matching polo shirts, etc. Companies could manage garment programs internally, but this entails various complexities they’d rather not spend time on. You could order a dozen maroon polo shirts from Amazon, but there’s no guarantee that Amazon will have in stock the same shade of maroon in a given size to outfit new employees as your business grows. If a plus-sized employee is replaced by someone with smaller dimensions, you’ll need to buy a brand new uniform while the XXL shirt and pants sit on the shelf. Over time, you will find yourself tying up more and more cash in garment inventory and volatizing cash flows with unpredictable garment purchases. By assuming inventory on their own balance sheet, a uniform rental provider can help dampen the swings and ensure you get exactly the right uniform when it is needed.
The business of buying and renting uniforms is operationally complex (not only are rental providers collecting shirts, they are cleaning and returning them to customers as well), vulnerable to alternatives (customers can always just buy shirts and pants for their employees) and, outside of enterprise accounts, isn’t protected by high switching costs, which limits pricing power. And yet, Cintas has created enormous value for shareholders, its stock compounding by 15% over the last 20 years and 27% over the last 10 (before dividends). Over the last decade, they’ve outgrown primary competitors Unifirst and Vestis on an organic basis and realize far more revenue per employee and facility than either. They’ve done so through a combination of better route density and superior execution, the latter evidenced through ERP modernization, vertical-specific offerings, and smart M&A.
Vestis recently spun-off from Aramark, an inattentive owner who mismanaged the company for many years. The turnaround story involves margin expansion and accelerating organic growth, powered by cross-selling and route optimization. I have concerns about the practical difficulties of dual-purposing unionized truck drivers as salesmen and question whether Vestis’ antiquated systems can support the logistical complexity required to compete head on with Cintas, who spent a decade modernizing its ERP.
At the time it was spun-off of Allegheny in 1991, Teledyne was primarily in the business of selling electrical components and subsystems – devices that amplified microwave signals, transmitters and receivers that send signals from aircraft to ground equipment, sensors and software that stored telematics data, etc. Starting in the early 2000s, they made a series of margin accretive acquisitions that expanded their presence in Instrumentation, which you can think of as things that measure hard-to-see physical phenomena (sonar systems that map ocean floors; gyroscopes and accelerometers that measure location and speed; instruments that precisely measure gas flows and monitor air quality); and Digital Imaging, sensors that convert light waves into digital representations. These acquisitions transformed Teledyne. In 2004, the company got 80% its revenue from selling aerospace electronics and serving as a prime contractor for the US government. Ten years later, those businesses were whittled down to just 35%. The balance came from Digital Imaging and Instrumentation products used mostly in commercial applications, which has remained Teledyne’s primary focus since.
The next 7 years were characterized by progressively larger deal sizes in instrumentation and digital imaging that ultimately culminated in the whopping $8bn purchase of FLIR (short for “forward-looking infrared”), which made sensors to identify heat emissions from industrial gases, greenhouse gases, enemy combatants (night vision goggles), and overheating factory machines. At the time it was announced, the deal represented 54% of Teledyne’s total enterprise value and more than twice the $3.7bn spent on all previous acquisitions combined.
The FLIR acquisition was consistent with Teledyne’s pattern of buying adjacent technology. But the valuation was surprising. As late as 2019, they expressed bewilderment that anyone would pay 17x. Then, just a few years later, Teledyne announced they would be buying FLIR for…17x EBITDA! (more like 20x excluding the one-time COVID sales). And it’s not like FLIR was a fast growing gem of business. It had been mismanaged for some time and was growing by just 1%-2% when FLIR bought them. Even with optimistic growth assumptions and full credit for cost synergies, Teledyne paid 11x year-5 EBITDA, still a far cry from the 10% after-tax returns within 2-3 years that they’ve historically targeted.
But the collection of businesses Teledyne has rolled up over the years generally seem like good ones. Most of the high-end imaging and instrumentation niches where Teledyne plays are rational oligopolies. Their products are designed into systems with long development cycles and lengthy qualification processes, making them tough to displace. They are sold to customers who care far more about performance than price, insulating them from low-end Chinse competition.
The businesses don’t generate much growth, though. On a consolidated basis, organic revenue has grown by just 1.5% over the last decade. Adjusting for the mix shift toward Digital Imaging, forward growth is maybe more like 4%, but that does get you much more than 5%-6% organic earnings growth. You probably aren’t paying any more than 16x-17x earnings for something like that. If they can re-invest all their earnings into acquisitions at 10% after-tax returns, as they’ve done historically, you might justify the low-20s multiple that they trade at today. But can they? Will they?
AMETEK reminds me of Teledyne in several ways. It began its life in industrial machinery before acquiring its way to higher margin, more technically differentiated and less capital intensive areas. This includes instruments that measure and test things that are very close and very far away, stuff like: mass spectrometers and electron microscopes used by scientists to understand the structure of compounds and by semi manufacturers to detect impurities in silicon wafers; optical assemblies (lenses and mirrors that manipulate light) used by astronomers to study the planets; rheometers used by consumer goods manufacturers and coatings companies to assess how fluid-like materials behave under different stresses.
Alongside that is a smaller division that sells instruments that capture aircraft telematics, ruggedizes off-the-shelf components from other tech vendors (FPGAs from Xilinx, routers from Juniper) for aerospace and defense platforms exposed to extreme environmental conditions, supplies utilities with simulation tools to test the integrity of their grids. More recently, they’ve made a big splash in healthcare, now their single largest end market at 20% of revenue, with the acquisitions of Rauland-Borg (call stations, mandated by regulation, that patients use to call for help and that nurses use to receive those calls) and Paragon Medical (surgical instruments, bone screws, hip implants, rods, springs, wires, etc.). The acquisitions seem all over the place when viewed through the lens of end market exposure. But what they generally share in common are #1 or #2 positions in $200mn-$500mn oligopolistic niches, products with high switching costs, and, under AMETEK’s ownership, the rigorous application of kaizen values (AMETEK once referred to itself as a “mini-Danaher”). Revenue is wildly cyclical, geared as it is to a long tail of industrial markets, and organic growth through the cycle looks similar to Teledyne’s.
AMETEK has paid progressively higher multiples for higher quality, faster growing businesses (7x-8x in the early/mid-2000s to 15x for Paragon). The days of buying undermanaged companies for high-single digit multiples and doubling margins over 3-5 years are over. Compared to 10-20 years ago, they are leaning more so on growth than profitability improvements to hit their 10% after-tax return bogey within 3 years.
Of the 3 serial acquirers I covered this year, Roper has undergone the most extreme business transformation. From its starting point in capital intensive industrial equipment, Roper acquired its way into test and measurement instruments during the ‘90s, then software throughout the ‘00s. Management was intentionally targeting capital light businesses with high margins, recurring revenue, and modest macro sensitivity, with the directive that each new acquisition should be better on those dimensions than the portfolio average. If the bar is ratcheted higher every year, then whether you originally meant to or not, you will eventually end up buying software companies.
Roper’s software acquisitions covers a wide range of verticals and are grouped into 2 divisions: Network Software that, for instance, matches shippers with truck drivers (DAT), pairs general contractors with subcontractors (ConstructConnect), and consolidates purchase activity across long-term care facilities (MHA); and Application Software, which you can think of as industry-specific ERP software that customers use to run their operations. A prominent example of the latter is Vertafore, which P&C insurance agencies and brokers use to manage sales pipelines, renew state licenses, and track agent commissions, among many other things. Given how mission critical these products are to day-to-day operations, it comes as not surprise that Roper’s software divisions retain 95%+ of customers and consistently push through price hikes.
Roper is organized in a decentralized fashion, with 28 business units, each run by a manager with near full discretion to make strategic and operational decisions, though they do so within tight governance constraints that prevent financial metrics from veering off track. Capital allocation, meanwhile, falls in the hands of a handful of executives at headquarters, who work with third party professional services firms to diligence transactions. Nearly everything Roper buys comes from a private equity, Thoma Bravo and Vista in particular. Whereas a private equity firm will cost cut their way greater profitability over a 5-year time horizon, Roper, as a “forever” home, has the luxury of optimizing for growth and creating value over long time horizons. And thanks to their investment grade rating, they can borrow a much lower rates than a private equity sponsor.
Owners in both parts of the lifecycle can realize respectable returns. A PE sponsor who pays 27x depressed EBITDA for a 5% grower, funds the purchase with 8 turns of leverage, doubles margins over 5 years, and flips to Roper at 18x, will generate a 19% levered IRR. By taking organic growth up to 7%, funding with 4 turns, and expanding margins by ~30bps a year, Roper in theory might expect ~12%-13% levered IRRs, assuming a 15-year time horizon and a terminal EBITDA multiple of 13x
This is not to say that Roper has a dominant advantage when it comes to winning deals. They can’t outbid a strategic for a target with easy synergies, or even a private equity firm for a mismanaged target with a broken cost structure. But for well-run companies with full margins competing in modestly sized markets, a long time horizon, low funding costs, and competency at accelerating organic growth allow Roper to create value to an extent that neither strategics nor private equity can.
Most of Xpel’s revenue comes from selling a product that you may not even know exists. And that’s kind of the point. When installed right, paint protection film is hard to see. But its invisibility belies its utility. A thin and transparent wrap, comprised mostly of a versatile material called thermoplastic polyurethane, PPF protects a vehicle’s paint from scratches, bird droppings, acid rain, bug splatter, UV rays, and gravel strikes, with “self-healing” properties that allow the film to reconstitute itself after minor assaults.
In 2023, a widely circulated short report on Xpel[55] made two central claims: first, that Xpel gets much more of its revenue than it disclosed from Tesla, who was bringing PPF installation in house; and second, that PPG Advanced Surface Technologies (PPG AT), a joint venture between PPG and entrotech, “have developed a way to integrate entrotech’s paint protection technology directly into PPG’s paints” and that “the JV will set to integrate this technology directly with OEMs, straight from the production line, hence virtually eliminating the need for Xpel’s clunky aftermarket wraps”, obviating XPEL’s entire business.
As my conversations with PPG and Ford (the OEM supposedly integrating this supposed PPF-paint hybrid) made absolutely clear in no uncertain terms, the existential claim about PPF technology being integrated into PPG’s paint was fabricated. The Telsa concern had a bit more teeth to it. I called a bunch of dealers and, indeed, a disproportionate number of vehicles they wrapped were Teslas. But on the whole, they were not seeing much, if any, impact from Tesla in-sourcing. Moreover, a week prior to the short report’s publication, Xpel explicitly disclosed that its “paint protection film-related revenue (including product and service) with respect to Tesla vehicles is approximately 5% of its total year to date revenues”. The short seller interpreted this announcement as a desperate attempt to support the stock, which doesn’t make a whole lot of sense.
Consider what it means for the short seller’s claim to be right. Xpel dealers must enter into DAP the car model whose templates they want to cut from film, meaning management almost certainly knows how much film revenue is tied to each car model with a very high degree of accuracy. So by privileging survey results over Xpel’s disclosure what you’re essentially saying is that management, knowing the real percent of revenue coming from PPF installation on Teslas, deliberately published a fake number instead. So, after rescuing Xpel from near ruin and methodically building it over 15 years to a profitable market leader that is firing on all cylinders, Ryan Pape just decides “screw it, time to commit blatant securities fraud and risk career, personal reputation, and financial consequences that are bound to be far more disastrous than just saying the real Tesla number?” That’s a pretty bold claim, in my opinion.
Imagine you are General Counsel of a F1000 company and want to sue a competitor for violating your company’s intellectual property. While you have strong case, litigation is an inherently speculative undertaking. You don’t know whether the defendant will settle or fight and, in the latter case, whether a judge or jury will rule in your favor or even how long it will take for them to do so. Rather than run ongoing litigation expenses through the income statement, crimping the reported earnings that investors capitalize, in return for an uncertain payoff, which investors dismiss as a one-time event, you would much prefer the law firm you’ve hired to work on contingency, bearing the expense of litigation and sharing the spoils of a successful outcome. But the law firm, culturally and financially ill-suited to assume such risk, prefers the assurance of hourly fees.
This is where a commercial litigation funder like Burford steps in. Burford will commit to paying the law firm’s fees up to a certain amount and in turn take a percentage of any resulting settlement or damages paid. The client gets a free option on litigation; the law firm gets fixed hourly fees to pursue damages even as it serves the client on a contingent fee basis; and Burford, who pays fixed hourly fees to the law firm or corporate client, gets a piece of any resulting payoff.
In what seems like ages ago now Fintwit darling, Burford Capital, was flamboyantly attacked by Muddy Waters. The prominent short seller claimed that Burford “misleadingly boosted its IRR numbers”, rendering ROIC and IRR metrics “meaningless”; misled investors through the “egregiousness of its fair value accounting”; and was “arguably insolvent”, raising outside capital as a matter of survival rather than growth. These charges followed on the heels of a Canaccord Genuity analysis from Apr ‘19 that found Burford’s reported ROIC “confusing and significantly above reality”.
For most of this post, I once again provided a long-winded rebuttal of that bear case. My argument largely resolves to:
contrary to common perception that Burford’s historical returns are the result of one-off windfalls that we can’t bank on going forward, I would argue that settlements provide an engine for repeatable outcomes – outcomes that deliver, if not spectacular, at least solid returns – for approximately 70% of Burford’s invested capital. Moreover, Burford boasts an enviable track record outside of settlements. Just over 70% of capital deployed on adjudications from inception to 2023 has generated gains, up from 65% from inception to 2019.
and…
it appears much harder to compete away returns than many bears imagine. There is only so much capital that can be put to work in any given deal, the underwriting process doesn’t scale well, and its accuracy is aided by proprietary data that takes years to acquire. Given the resources, time, and lack of scalability, not to mention the added complication of suing enterprises that you’d like to maybe have business relationships with, I somehow doubt that someone like Blackstone is taking this market all that seriously.
But the lack of scale also pushes back against the bull case. Sure, Burford might generate strong asset level returns. But lawyer salaries (litigation finance deals don’t scale), finance costs, and taxes consume a lot of this. Consider that Burford’s tangible book value per share ex. YPF (a one-off windfall that we can’t really expect to repeat) has only grown by between 8% and 11% over various 7, 10, and 12 years. And from 2010 to 2015, before YPF was even in the picture, TBV/share grew by just 5%/year. While the YPF proceeds alone, should they be paid (a big “if”), account for more than all of Burford’s enterprise value, the most committed bulls seem to believe the stock is only pricing in the value of Burford’s non-YPF business (i.e. “you are getting YPF for free”). I don’t agree. Ex. YPF, Burford’s stock trades at 4x TBV. Having grown TBV by just 8%-10% historically, why should they be valued at such a lofty multiple?
Lamb Weston is the largest frozen potato processor in North America, with 40% share of a market dominated by 3 players, all of whom have origins dating back to the early 1900s. More than 80% of its production is concentrated in Oregon, Washington, and Idaho, giving it more exposure to the highest quality crops than Simplot and especially McCain, who compared to Lamb are more heavily skewed to the Midwest and East Coast.
Over the last decade, Lamb Weston has generated ~high-20s pre-tax returns on capital. Why couldn’t a new entrant compete these mammoth returns away? Well, what management and industry folks will often say is that even assuming a new entrant had access to the ~$500mn+ required to build a processing plant, they’d have to somehow dislodge the decades-long relationships that the big 3 have cultivated with farmers and customers. In 2016, Lamb disclosed the average duration of its customer relationship to be 28 years, with its longest going back 45 years. Meanwhile, Lamb’s average farmer had been growing for them for 15 years, 35% of them for 20 years. Also, new plant builds are usually anchored by volumes from a major QSR. For McDonald’s, french fries are a menu item they absolutely can’t screw up, so why roll the dice on a new processor? In securing QSR volumes, the big 3 enjoy scale production economies and procurement savings on key processing inputs that a newcomer does not.
Of course, this doesn’t immunize Lamb’s earnings from volatility. The abnormally hot summer in fy21 produced potatoes with unusually low starch content, which on a largely fixed cost manufacturing base, resulted in higher per pound processing costs, and forced Lamb to buy potatoes in open market at huge premiums to meet volume commitments to customers. Rising potato prices, along with labor shortages and double-digit inflation in transportation and oil costs, caused Lamb’s margins to contract significantly in fy22.
Lamb successfully pushed price through to its customers, recouping incremental costs from the heat wave and supply chain shortages. It was able to do so because frozen potato processing capacity in North America has been very tight over the last 7 years, well above the historical range of 93% to 97%. The 5.6bn incremental capacity that the industry is expected to add through 2027 supports strong utilization assuming demand grows between 2% and 4%. But that’s hardly a given. USDA data shows several 5-year stretches where per capita demand was flat-to-down 1%. In that scenario, capacity utilization would fall all the way down to 89%. By my estimate, it appears we are looking at ~10% more capacity in North America, outpacing lsd demand growth. Lamb Weston would be more exposed than others because its idiosyncratic volume challenges – the purposeful shedding of 4 low-margin contracts and a botched ERP rollout resulting in unfulfilled orders, which exacerbate headwinds from deteriorating restaurant traffic – suggest its capacity utilization is likely starting below that of peers.
I bought some XPEL shares in March and wrote some nice things about them. Naturally, soon after, the company reported an awful quarter and the stock cratered. Management cited broad aftermarket weakness in the US – “it was not uncommon to see dealers who were down 10%, 15% in the first quarter from the prior year period” – and a horrendous 78% revenue collapse in China.
But there were some silver linings: 1) port delays in the US caused a ~20% reduction in sales of Porsche’s and Audi’s, two of Xpel’s top brands for film coverage, and this disruption was resolved toward the end of the quarter, perhaps explaining Xpel’s atypically strong m/m growth in April; 2) outside of the US and China, Xpel continued to grow at an impressive clip, as did 3) revenue from Installation Services, where Xpel realizes revenue from selling and installing film itself.
IS growing 35% despite double-digit declines in retail implies really strong growth from the new car dealerships and OEMs that make up the rest of this segment. I think this is an important point, one that is easy to overlook. A key unresolved matter for the bull case is whether PPF adoption can spread beyond enthusiasts. That Xpel continues to report strong growth at auto dealerships and OEMs, two critical channels for reaching mainstream car buyers, is evidence that it might.
CEO Ryan Pape again directly addressed the allegation that a disproportionate amount of revenue comes from Tesla:
“There’s this idea that all of the revenue is concentrated in one brand or 2 brands or something. And that’s really not the case. I mean, I think we talked about the type of make related concentration last year, like 5% or less…I really just can’t stress enough that there isn’t a single point concentration risk into any one vehicle in this business”
I later followed up with Ryan. One key point from my conversation with him: about 30% of Xpel’s revenue comes directly from dealerships or from aftermarket installers who work only with new car dealerships. None of these installers or dealerships work on Tesla’s and none of them will be found on Xpel’s “Find An Authorized XPEL Installer” tool that both the short seller and I used to source leads. So, if your diligence consists of calling aftermarket installers listed by Xpel and asking “what percent of your installations are Tesla’s”, you are missing 30% of revenue for which the answer is “0”.
The market for fixed income trading platforms has consolidated into an oligopoly, with MarketAxess, Tradeweb, and Bloomberg at its center. A number of other competitors have emerged over the years, some are still around (Trumid), others have failed (Bondcube, Algomi). But, for the most part, when an asset manager like PIMCO buys Treasuries or corporate bonds from a sell-side dealer or even another buyside participant without picking up the phone, more likely than not they are doing so through one of those 3 platforms
When I first wrote up MTKX and TW in November ‘20, both companies looked like inevitable winners as bond traders flocked to their electronic platforms in search of liquidity. Since then, their results have diverged starkly. Through net spotting, Tradeweb successfully leveraged its Treasury franchise to claim significant volume in high-grade credit. It was also early to market with Portfolio Trading, a protocol that allows a large collection of bonds to be bought and sold at a single net portfolio-level price. PT’s growing popularity has coincided with the ascent of fixed income ETFs, as the ability to efficiently trade large bundles of securities in one go is especially useful for market makers involved in the creation/redemption process, where ETF shares are exchanged for the cash bonds underlying them.
MarketAxess also began offering its own version of Portfolio Trading but never took it as seriously as Tradeweb, fixated as it’s long been on pushing Open Trading, which allows all market participants to anonymously trade with one another. Since launching in 2013, OT has become the central point of differentiation for MarketAxess, intermediating ~34% of its volumes. It is their ambitious attempt to create a new market structure, one that they hope will come subsume all major protocols and fixed income asset categories. OT tends to thrive in high vol environments, when liquidity is scarce. But if the last decade is any indication, low volatility appears more the norm than management would like to admit.
That MarketAxess has fallen so far behind Tradeweb in PT and so aggressively pushes OT also points to a philosophical difference between how the two platforms approach the broader ecosystem. Perhaps as a result of its origins as a dealer-backed consortium and its substantial dealer-to-dealer activities, Tradeweb has always worked more in harmony with the existing, dealer and phone-dominated ecosystem. MarketAxess, on the other hand, has never never been shy about placing themselves at the center of the ecosystem, with dealers and investors serving as spokes around the Open Trading hub. I suspect that by pushing OT so doggedly, MarketAxess alienated broker-dealers and neglected protocols, like Portfolio Trading, that depend on them, creating an opening for Tradeweb, who has always maintained a less revolutionary, more cooperative posture.
This multi-part series concerns the building materials (BM) industry, specifically the layer downstream of timber growers and upstream of home builders, home centers, and remodelers. Investors applaud canonical compounders like NVR and Home Depot and have in recent years been losing their minds over Floor & Decor. But beneath that strata of the value chain is a thriving ecosystem of manufacturers and distributors that is rarely discussed by generalists or even dismissed as unworthy of study.
With lumber prices soaring during COVID, the last few years have been pretty wild for those – like BLDR, BXC, BCC, and LPX – most geared to the vicissitudes of commodity wood pricing. BLDR and BXC free cash flow’ed 1.6x and 3.8x their 2019 year-end market caps, respectively, in just 2 years!
A big chunk of the post explores the causes of soaring lumber prices during COVID and quantifies the extent to which the US housing market remains in deficit. Towards the end, I discuss BlueLinx, a “two-step” distributor that sources wood products from mills and distributes them to lumber yards and home centers, who in turn re-sell to builders and contractors. BlueLinx has had a long and troubled history since it was taken public by Cerberus in 2004. With 4 turns of leverage on peak earnings, the company spiraled into near oblivion when the housing crisis hit.
Fortunately, BlueLinx owned real estate whose value nearly covered its enterprise value and over the next decade, they sold and leased back properties to pay down debt. Along the way, they tripled their share count with two massive rights offerings and downsized operations. Nevertheless, BlueLinx spiraled in the shitter for a while. In 2016, even with the worst of housing crisis in the rear view, BlueLinx’s market cap plumbed new lows and its stock, trading below $1, was on the verge of being delisted. The first break in this dolorous state of affairs came in the form of Cedar Creek, another two-step distributor that BlueLinx acquired in 2018. But the integration was shaky, one of Cedar Creek’s major siding programs was lost, housing starts were weak, and commodity deflation offset much of the realized cost synergies. By the end of 2019, before COVID was on the radar, the stock had collapsed ~80% from its 2018 peak. At ~$14, shares traded for less than they did before the transformational, synergy-rich merger was announced.
Then COVID hit, lumber prices went ape shit for a few years, and BlueLinx reported gross and operating margins that it never came even remotely close to achieving in its history as a public company. Management thinks that after the COVID craze, things have now settled to a sustainable place. But gross and EBITDA margins are still well above historical norms and I’m skeptical that whatever operational gains they’ve made are enough to counter mean reversion, especially considering the structural challenge of major home centers and lumberyards sourcing directly from mills.
By the mid-90s, Vinyl overtook wood to become the most common siding material in the US. Unlike wood, vinyl siding can be mass produced in a factory. It isn’t susceptible to insect infestation or water rot, and endures for more than 20 years without maintenance and repaint. It is far lighter and easier for contractors to handle and install. To a homeowner, the cost of a vinyl siding project is ~1/10 that of hardwood. But Vinyl has important downsides too. It warps in extreme heat, cracks in extreme cold, and damages more easily when exposed to strong winds and hail. The wood patterns that manufacturers emboss onto it fade over time. Vinyl is used because it is reliable and cheap, not because it is pleasing to look at.
Homeowners willing to yield on price can get the durability of vinyl and the aesthetics of wood or stucco through two other options: fiber cement (a hardened slurry of cement and wood fiber) and engineered wood (an enhanced formulation of OSB). Of the dozen or so exterior cladding options commonly available, these two have gained the most prominence over the last 20 years. Their popularity has come at the expense of vinyl, whose share of siding has declined from 35% in 2010 to around 20% today. The fiber cement and engineered wood siding categories are near monopolies, with James Hardie claiming 90% of fiber cement and LP’s SmartSide brand claiming ~85% of engineered wood. Both are vice-gripped into the value chain by the pull of homeowners and the push of contractors and dealers, making them difficult for competitors to dislodge.
That LP has come to command a meaningful presence in a branded specialty category like siding is surprising given how rooted it is in OSB, a classic commodity. Whereas OSB is a commodity whose profitability is largely governed by pricing and single family housing starts, which are impossible to predict and fluctuate wildly, Siding is a branded business with steady pricing power that derives 60% of revenue from relatively more stable repair & remodeling demand. Siding margins are higher and far less volatile too, with profitability far more a function of production efficiencies and capacity utilization than commodity price trends. So, over the years LP has been converting legacy OSB plants to siding plants and within siding, mixing volume toward still higher value ExpertFinish lines, creating a visible path to higher margins and returns on capital.
The themes in residential decking are similar narrative to those animating residential siding. Wood is still used in 75% of decking projects, but that’s down from 95% in 1999 and probably on its way to 40%-50% as share continues to shift to composite materials (wood fiber + plastic), as composite has consistently taken anywhere between 1 to 2 points of share from wood per year over the last decade, with gains fueled by expanded selection and enhancements in durability and appearance. Every point of share donated by wood translates to 3%-4% growth of the composite category as a whole. The premium one pays for composite relative to wood is more than made up for by lower maintenance and superior longevity. Over a span of a quarter century, the total cost of ownership of a wood deck is more than twice that of one made of composite.
Within the composite category, Trex claims about 40% share and Azek has another ~30%. As is the case in residential siding, Trex is “vice gripped” into place by unrivaled brand awareness among homeowners (90% of surveyed homeowners are aware of the Trex brand and more than 60% of web traffic in the decking category is claimed by Trex-owned sites, an important source of leads for qualified remodelers who are fortunate enough to be listed) and exclusive relationships with a handful of two-step distributors in each of their markets. Trex is the only composite brand stocked on shelf at both Lowe’s and Home Depot, reinforcing its position as a trusted consumer brand.
Trex resembles James Hardie in several respects. James Hardie commands 90% share in fiber cement category, which itself comprises 20% of the overall siding and trim market. Trex has ~40%-50% share of composite decking, itself just 25% of the overall decking. Both James Hardie and Trex are established brands with robust channel support. Both expect ~10%-12% organic growth, supported by remodeling spend and category penetration against vinyl (in James Hardie’s case) and wood (in Trex’s). Both generate 30s EBITDA margins with ~35%-40% incrementals, translating to ~35%-40% pre-tax returns on gross capital (gross PP&E + working capital) at scale. And both strike me as appropriately priced for the high quality businesses that they are.
Builders FirstSource (BFS), the main subject of this post, is a pro dealer that distributes the structural components that comprise the skeleton of a house….framing lumber, OSB, engineered wood products, and floor and roof trusses, as well as complements like wall panels, siding, doors, and window frames. They sell hundreds of thousands of SKUs across ~570 locations in 43 states, boasting #1 or #2 share in 89 of the top 100 MSAs. Around 2/3 of revenue is tied to single-family home sales, another 20% and 13% to repair & remodel and multi-family structures, respectively.
BFS has been transformed through so much M&A that I think of it less as a consistent, singular identity than a corporate name affixed to ever more grandiose expressions of the idea that pro dealers can better and more profitably serve builders by moving the production of structural components from jobsites to manufacturing plants and by offering a broad assortment of SKUs across a dense, nationwide network of branches. The Builders FirstSource that we know today is a nested collection of rollups, each migrating up the value stack and reaching new markets in parallel before fusing together under a single corporate owner:
Like BlueLinx, BFS had a tough go of it during and in the years following the GFC. But by 2014, years into a tepid housing recovery, Builders began to flicker back to life. Losses inflected to profits and free cash flow dribbled out. Over the next decade, BFS didn’t merely resume its small-ball M&A program; they rage-acquired their way to the top, as if making up for lost time. Since 2004, Builder’s has spent $7.9bn on acquisitions, $7.8bn of which has been concentrated in just the last decade. Two acquisitions – ProBuild (July ‘15; $1.8bn; 5.5x post-synergy EBITDA) and BMC (Jan ‘21; $3.7bn; 8.4x post-synergy EBITDA) – account for around 2/3 of that spend.
As BFS amassed scale and influence, they increasingly sourced lumber directly from mills and value-added SKUs directly from manufacturers, keeping more margin for themselves. The more significant way Builders has evolved, though, is in thinking about the homebuilder’s P&L rather than their own. BFS could have limited their activities to buying mixed lengths of lumber from mills; chopping them up to lengths required by builders; ensuring the right planks are delivered to the jobsite on time for the next build phase; and always staying in stock. But they extended to other facets of a homebuilder’s job: hammering lumber planks into frames and trusses; streamlining the build process to hasten turnaround times; providing installation services through third party subcontractors; and even managing a digital platform through which builders can not only order products and pay bills, but even 3D model projects and schedule workflows.
Still, the emphasis on prefab components should be appreciated, not as an isolated goal, but as central to the broader strategic aim of running an “everything store” for homebuilders’ lumber-based material needs. BFS will bundle relatively stickier and relationship-driven value-added SKUs with commodity lumber as part of an overall package, yielding what they must to maintain share in the latter while re-capturing lost economics through the former.
Like BlueLinx, BFS’ gross and EBITDA margins exploded higher during the COVID years and while they have come down a lot from the peak, they still remain well above historical averages. Management believes this a new normal but I am skeptical.
Atlas Engineered Products is a thinly-traded nanocap based in Canada and the only publicly traded pureplay truss manufacturer I’m aware of. It was founded by its current CEO, Hadi Abassi, who in 1999 paid C$50k for a small truss plant in Nanaimo (Vancouver Island), taking it from less than C$100k in revenue to nearly C$6mn over the next 16 years. He observed that in Canada, truss manufacturing was scattered across mom-and-pops and took Atlas public in 2017 through a reverse merger with the aim of rolling them up. Seven years later, Atlas owns 8 plants, the 1 plant in Nanaimo that Hadi acquired in 1999 plus 7 more picked up through acquisition.
There are 3 key pillars to the bull case. 1) the Canadian housing market is very tight. 2) Atlas pays low-single digit EBITDA multiples for acquisitions and realizes huge improvements in profitability by modernizing those acquired plants, sourcing lumber directly from mills, and cross-selling joists. 3) by outfitting plants with robotics, they will be positioned to “double output and reduce labor costs by 50%, and that is very, very conservative”.
Some pushback:
First, the implied multiple that Atlas paid for its largest acquisition, LCF, was very much deflated by an EBITDA denominator that surged during the COVID lumber boom. Second, I am having trouble reconciling the reported financial results with Atlas’s bullish qualitative claims. To put it succinctly: if I sum the trailing revenue of all of Atlas’ acquisitions at the time they were announced (adjusting LCF to a lower, more normalized level) and add to that Atlas’ fy17 (pre-acquisition) revenue of C$8mn, I get to C$56mn. Atlas reported C$53mn of revenue in the 12 months through June ’24. If you do the same exercise with EBITDA, you get C$10mn compared to the reported figure of C$9mn. So…where are the organic growth and cost synergies? And given that Atlas paid just ~4x+ EBITDA for most of its plants and maybe more like 7x-8x mid-cycle for Hi-Tec and LCF, you’d expect something greater than 11% pre-tax ROIC.
Finally, I spoke with an executive who observed robotics in use at Trussway and then at BFS. He was outright skeptical of Atlas’ theoretical return assumptions. Differences in labor costs, plant setup, and other implementation details could account for some of the gap. But the productivity gains that Atlas is proposing – triple digit leaps in output with a fraction of the labor cost – would be impossible to overlook if they were, in fact, being realized by others in practice today.
I know many of you are bananas about Atlas, so don’t take this the wrong way. I think there a several interesting aspects to the Atlas thesis, including gusty tailwinds from a housing-constrained market and the leadership of a committed and dynamic founder with considerable skin in the game. Still, given the absence of proprietary IP and learning curves, as well as the commodity nature of trusses generally, I think bold proclamations about a robotics-driven structural ROI reset should be received with some skepticism.
Wise is a cross-border money transmitter that bypasses the labyrinthine SWIFT network by taking on laborious work of establishing direct connections with local banks and, increasingly, direct connections to a country’s payment rails. In doing so, they are able to offer their customers significantly cheaper and faster cross-border transfers than conventional banks. On both dimensions, speed and price, Wise outcompetes traditional banks, who take around 2 to 5 business days and charge anywhere between 2% and 7% to move money cross-border.
Nor do banks offer an experience that is anywhere near as clean and transparent. The process of sending a transfer through the Wise app is about as straightforward as it gets. You pay-in funds to Wise through a domestic transfer or card payment and enter the foreign recipient’s account details. After running KYC and fraud checks in the background, Wise will convert currency at a mid-market rate and clearly disclose the transfer fee, FX rate, and estimated time it will take for the recipient to receive their money, with live updates and timestamps at each step of the transaction. This feels like magic to anyone accustomed to sending international wire transfers through bank[65]s, who usher users through clunky displays, hide fees through marked up exchange rates, provide no guidance on when funds will reach recipients nor any visibility on which checkpoints have been reached in the transfer chain.
Wise operates according to a cost-plus model, where any cost reductions beyond those required to sustain a target margin are recycled into lower take rates for users. This policy is enforced at a granular level, such that no corridor, product, or customer segment is allowed to cross-subsidize another. Wise is fanatical about being the cheapest and fastest money transmitter. Its maxim, “Mission Zero”, encapsulates the continuous erosion of fees up until their ultimate elimination. The dual mandate of lowest price and sustainable profits requires an intense focus on whittling down unit costs, which it does not only by establishing connections to bank partners and local rails, but by running scalable cloud infrastructure and exercising frugality in aspects of the business that do not directly tie to customer benefit. Conventional banks have neither the bilateral connections, the culture, nor the modern technology stack to compete.
Flywheel: more volumes means lower transfer fees and more leverage against fixed costs of engineering and product development, with cost savings plowed right back into lower transactions fees for customers, who in turn promote the service to friends and family.
From its origins in cross-border transfers, Wise expanded into a number of other products, the most significant of these being Wise Account, which allows small businesses and consumers to store and receive money denominated in more than 20 different currencies, in much the same way a local bank account holder would. Wise Account then sets the foundation for two other product extensions: Wise Debit card and Wise Assets. With a Wise Debit card, customers can spend in as many currencies as Wise supports. With Wise Assets, customers earn a return by investing their Wise Account balances in low-risk interest-bearing assets or in the iShares World Equity Index Fund.
I admire the careful and methodical way Wise has expanded its footprint. A lesser fintech would have taken a top-down approach to product development, placing bets on huge TAMs as they lurched toward a super app that cross-sells every conceivable financial service a consumer might need. A fintech that commands a desired end state into existence rather than allows its perimeter to be organically stretched is like a city, erected overnight, that lacks a certain cultural middleware tying things together.
Wise doesn’t work down from a sprawling, grandiose vision. Instead, product ideas bubble up from user demand and are only pursued if they directly reinforce the cross-border core. By this, I don’t just mean using an existing product as an on-ramp to another one (like PayPal offering crypto trades to P2P customers because it can) but ensuring the new thing directly leverages the thing it is best known for and even strengthens it. Wise doesn’t underwrite personal loans to consumers because, well, that’s got nothing to do with cross-border transfers. But it did launch a multicurrency wallet because: 1) that product takes advantage of the licenses and liquidity pools it had spent the prior 6 years building for international money transfers and 2) compared to drawing from an external bank account, doing so from funds already parked at a local Wise account accelerates transfer speeds, which reduces the time Wise is exposed to FX movements, lowering FX hedging costs. And because money is already in Wise’s account on the sender side before funds are sent to recipients, Wise Account transfers carry lower fraud risk. The resulting savings can then be plowed right back into lower transfer prices. Customers who park funds in Wise Accounts then need a medium through which to spend those funds and a way to generate returns in the meantime, hence debit cards and Wise Assets, respectively.
Some have speculated that stablecoins may come to represent an existential threat to Wise, but I don’t see it. A world where stablecoins are ubiquitously adopted for payments is one where, by extension, US dollars are too and, again, there are valid reasons why non-US countries would be wary of accepting dollar hegemony. Assuming local payments remain denominated in local currencies rather than in digital currencies backed by US dollars, stablecoins on the blockchain will eventually need to off-ramped.
That’s not to say stablecoins don’t have a place in cross border transactions. The US dollar is already the dominant vehicle currency for invoicing and settling global trade outside of Europe, even when US parties aren’t involved. Here, I can imagine stablecoins, which have the same value as US dollars but are cheaper and faster to transact with, replacing actual dollars and trade partners keeping those stablecoins in perpetual circulation. But Wise is not just in the business of transferring value across borders. It is in the business of transferring value across borders and converting that value to usable form in the recipient’s country. There is a big difference between the two.
The bigger concern is far more pedestrian: Wise might be a low-cost provider in cross-border transfers, but a neobank with a full array of services could be a low-cost provider of banking, generally, by virtue of how they bundle and cross-subsidize lending, asset management, primary checking, and other products. A neobank like Revolut white-labels rails from CurrencyCloud and could offer cross-border transfers to its customers at cost or, up to a certain limit, even subsidize losses through the subscription fees they charge to customers.
The next time you find yourself at the site of a half-built home, direct your attention to the joints of its wooden frame. You’ll notice a variety of nondescript steel components tying the planks together. Those are called wooden connectors and there’s a better chance than not that are made by Simpson Manufacturing. The company claims around 75% share of the North American market.
Punched out of high grade American steel, Simpson’s connectors are stress-testing in company-owned labs. Using massive hydraulic presses, Simpson can simulate the forces of a 7.0 magnitude earthquake or Category 5 hurricane on a four story building and evaluate how well their components hold up on various species of wood. The rigorous testing regiment establishes credibility with officials who are responsible for specifying minimum design and construction standards. Simpson’s products were referenced in more code reports than those of any other competitor. And not only does Simpson meet code requirements but, as the industry leader with the most rigorous testing requirements, they work closely with standards bodies and code officials to develop them as well.
To be clear, Simpson’s connectors aren’t literally written into building codes. It’s not like builders are mandated by regulation to buy Simpson-branded products. Codes will specify, for instance, that a wall withstand forces of a certain magnitude, but architects are given free reign to meet that specification however they want. It’s just that, if an architect wants to include an airy wall with lots of windows while still meeting code, the easiest way to do that is with connectors…and so, blueprints will often specify something to the effect of “Simpson connector or equivalent”. The builder decides which connectors to use but they will more often than not go with Simpson because the Simpson brand is specifically called out as a reference in code reports and has over the last 70 years established itself as the industry standard. So while Simpson connectors are not “spec’ed” in by regulation, for all practical purposes they may as well be.
This has the makings of a good business. A manufacturer of engineered components, de-facto spec’ed into design, essential to the structural integrity of a building but comprising a small fraction of overall costs, Simpson brings to mind widely celebrated compounders like Texas Instruments and HEICO. You can understand why Warren Buffett once reached out to Barclay about buying this company.
Having said that, over the years management has made a bunch of acquisitions in Europe that, on the whole, have been value destructive. Frankly, I do not understand Simpson’s preoccupation with Europe and see their continued involvement there, even after decades of subpar returns, as an irksome red flag in an otherwise accomplished track record.
Snap-On is best known for its Tools segment (40% of revenue), through which it sells tools, tool storage boxes, and handheld diagnostic instruments through 4,800 vans worldwide, 3,400 in the US. Those vans are owned or leased by a Snap-On franchisee and stocked with about 4k SKUs (out of a catalog of 40k), which are sold to mechanics along a designated route. The average franchisee tenure is ~15 years and annual turnover (including retirement) amounts to ~10%.
Why do more franchisees sell Snap-On over other brands? Because mechanics go nuts over Snap-On tools. When Frost & Sullivan asks technicians who makes the best hand tools, nearly 60% answer Snap-On. The second highest ranking brand garners less than 20% of the votes. The fandom accrued over its storied 100+ year history manifests in pictures of newborns with Snap-On wrenches in their hands and small Snap-On tool boxes repurposed as sacred urns containing burial ash.
Doesn’t the long-lived nature of Snap-On’s premium tools limited replacement demand? How many different tools does a mechanic really need? A lot, actually, and that number grows with the variety of car models. When auto OEMs design a new car, their attention is solely dialed in to reliability, safety, appearance, and features. The last thing they are thinking about is whether that new car model’s design is backward compatible with tools that were custom made to repair prior models. Instead, OEMs give Snap-On a heads up on a new model’s unique design features, so that Snap-On can design custom tools and distribute them to the OEM’s dealers. Through its 3.4k franchisees who make contact with ~850k technicians every week, Snap-On also has a recurring presence in repair shops, where it gathers intelligence about novel repair issues that its customers encounter.
The Repair Systems & Information (RS&I) segment, 30% of total revenue, sells capex-like equipment – tire aligners, car lifts, electronic parts catalogs, shop management software, and advanced diagnostic systems – to the independent garages and OEM dealerships that employ those mechanics. The most proprietary and compelling aspect of RS&I is SureTrack, its repair database. With 2.7bn repair records and 412bn records, much of which is proprietary, SureTrack boasts the most comprehensive repair database in the industry, providing time constrained technicians with a short cut to what is likely the highest probability fix for any given trouble code. This proprietary data is also inaccessible to third-party diagnostic instruments, giving Snap-On’s own tools a competitive leg up.
The Commercial & Industrial segment, 25% of revenue, gets around half of C&I consists of Bahco, which sells hand tools in Europe to the trades through third party distributors. The other, more strategic half is what management often describes are “the Snap-On brand rolling out the vehicle repair garage to other industries which are critical”, industries like military (the segment’s largest exposure), aviation, mining, and oil & gas, where the cost of failure is unacceptable.
Tools, Repair Systems & Information, and Commercial & Industrial are Snap-On’s operating divisions, with Tools being the most competitively differentiated of the three. Together, they grow topline about ~3%-4% organically and bottom line a few points faster than that. Running alongside those is the financing division, Snap-On Credit (SOC), which mostly serves the tools segment. Seeing as Snap-On’s customer base is predominantly made up of technicians with sub-prime credit, one might expect the SOC portfolio to be prone to blow-ups. But that doesn’t appear to be the case at all. Mechanics depend on tools and diagnostic systems to make money. Only in dire circumstances will they discontinue payments on products essential to their livelihoods. Those payments are collected by franchisees who have developed an understanding of the creditworthiness of the mechanics they serve after calling on them week after week. After backing out the value of SOC, the operating businesses trade at about 18x net earnings, which seems about fair.
Disclosure: At the time this report was published, accounts I manage owned shares of $GFL and $XPEL. This may have changed at any time since
some thoughts on Charles Schwab
Posted By
scuttleblurb
On
In
SAMPLE POSTS,[SCHW] Charles Schwab |
9 Comments
I have a post on APi Group and Amphenol coming toward the end of the month but before then I wanted to offer some thoughts on Charles Schwab. Nothing here is investment advice.
Last week I was joking with my friends LibertyRPF[69] and MBI[70] that Twitter felt like a time machine taking me back to 2008-2009, when as a young associate at Fidelity I was tasked with scrutinizing in gruesome detail the balance sheets of insurers and words like “held-to-maturity (HTM)” and “available-for-sale (AFS)” became fixtures in my daily vocabulary. I never expected HTM and AFS to come back into vogue, but here we are. Everyone reading this likely knows by now what these terms mean, but just in case here’s the definition from the SEC[71]:
HTM securities, which management has the intent and ability to hold until maturity, are carried at amortized cost. AFS securities are carried at fair value and unrealized gains and losses are reported as net increases or decreases to accumulated other comprehensive income (“AOCI”).
So what Schwab does is it deposits the cash balances from client accounts into its bank and mostly invests those deposits in US government-backed securities which, while rock-solid from a credit perspective, are still underwater thanks to rising rates. “AOCI”, which you can find in the shareholders’ equity part of Schwab’s balance sheet, primarily reflects after-tax unrealized losses on Schwab’s AFS securities, plus the after-tax unrealized losses on AFS securities that Schwab transferred to the HTM bucket last year to avoid having to include further unrealized losses in AOCI (this will become relevant later).
The “gotcha” hot take goes something like this: did you know that AOCI doesn’t include unrealized losses on HTM securities at year-end and that taking those losses into account would wipe out nearly all of Schwab’s tangible equity? Did you know??….the implication being that Schwab’s bank is technically close to insolvency.
But of course there is a difference, often a huge one, between tangible GAAP equity and regulatorily capital. In banking, there are several capital ratios that need to be maintained above a certain threshold. For Schwab, the most restrictive one is the Tier 1 Leverage Ratio, which divides Tier 1 Capital into assets and certain off-balance sheet exposures. For all but the largest banks16[72], you can basically think of Tier 1 capital as tangible common equity plus preferred equity minus unrealized gains and losses. What this means is that the unrealized losses on Schwab’s securities don’t impair T1 capital until those losses are realized, either through credit impairment or sale. Because the vast majority of Schwab’s investment portfolio is parked in super safe government-backed securities, its Risk Weighted Assets (the sumproduct of interest-earning assets multiplied by a risk weight proportional to each asset’s credit risk) are very low and its Common Equity Tier 1 Ratio (CET1 – tangible common equity minus unrealized gains/loss divided by risk weighted assets) is a whopping 22%, way above the 7% minimum. So Tier 1 Leverage the far more restrictive ratio and unlike the CET1 ratio, which only counts common equity as capital, any capital holes can be plugged with preferred stock from Uncle Warren.
Since 85% of Schwab’s securities are backed by the US government, we don’t really have to worry about credit quality. But we do need worry about Schwab being forced to liquidate those securities (thus converting unrealized losses to realized losses that hit T1) to meet deposit withdrawals from clients who want to take advantage of higher rates, a dynamic known as “cash sorting”.
At year-end, Schwab reported $40bn of Tier 1 Capital against $567bn of assets, for a Tier 1 Leverage Ratio of 7.2%. The minimum capital requirement is 5% so we’re starting with a $12bn capital buffer that organically expands as the balance sheet shrinks (more on this later).
So a critical question here is: will there be so much cash sorting that Schwab is forced to sell investment securities at a loss, thus dragging the Tier 1 Leverage Ratio below the 7% threshold and forcing a capital raise that potentially death spirals into abysmal dilution. The 22% decline in Schwab’s stock over the last 2 days suggests the market is assigning a non-trivial probability to this scenario.
Here are what I believe to be the sources of funding at the end of 2022, with numbers pulled from Schwab’s 10-K:
Cash: $40bn (excludes $43bn of “Cash and investments segregated and on deposit for regulatory purposes”)
Available FHLB secured credit facilities: $69bn (the Federal Home Loan Banks, FHLB, provides loan advances against a range of collateral to help member banks meet short and long-term liquidity needs. The haircut on government-backed collateral is small[73], 1%-2%, reflecting their liquidity and minimal credit risk. Subsequent to Dec. 31, 2022, Schwab drew down an additional $13bn of FHLB advances. Since we don’t know the intra-quarter sources and uses of funds, let’s ignore this for now. Doing so doesn’t materially impact the analysis)
US Agency and Treasury AFS securities that mature in < 1 year: $22bn (these could be sold without realizing material losses)
Federal Reserve discount window: $8bn
Unsecured commercial paper: $5bn
Uncommitted, unsecured lines of credit: $2bn
AFS securities at fair value minus the short-duration US Agency and Treasury securities listed above: $123bn
(in addition to all this, Schwab has another $173bn of HTM securities, which I treat as untouchable given the impact that realizing losses here would have on statutory capital)
There are a few important caveats.
First, in order to access FHLB funding, banks need to maintain positive tangible capital, the definition of which is set by the Federal Housing Finance Agency who, for reasons that defy logic, includes unrealized losses and gains on AFS securities. So you can see now why Schwab moved $173bn of AFS securities to HTM last year. Had they not done so, any further unrealized losses on those transferred securities would have hit their GAAP tangible equity and possibly compromised their ability to access FHLB funding.
However, even under this more onerous definition of tangible capital, I still think Schwab’s access to FHLB advances is secure. They reported GAAP tangible equity of $16bn at year-end and are generating ~$8bn of run-rate after-tax earnings. Their AFS securities were fair valued at $148bn, which includes $12bn of unrealized losses, $25bn of which rolls off in less than a year. So for Schwab to blow through its $16bn of tangible equity (even setting aside the considerable earnings build and the <1 year maturities) unrealized losses on AFS securities, 85% of which are backed by the US government-backed, would have to more than double from year-end levels. Eye-balling the maturity buckets of Schwab’s AFS securities, this might require a nearly 150-200 bps upward shift across the Treasury curve.
Second, the $69bn of available FHLB advances would be collateralized by a roughly equal portion of Schwab’s $307bn of securities ($148bn AFS + $159bn HTM), but I don’t know much of that collateral would be coming from AFS vs. HTM, so including the entire pool of AFS securities as a source of funds, in addition to $69bn FHLB advance, is double counting to some extent. $69bn of borrowing availability is about 22% of Schwab’s AFS and HTM securities. Multiplying that percentage by $148bn of AFS translates to about $33bn of AFS securities that are pledged as collateral to the FHLB and unavailable for liquidation, leaving us with $90bn of unrestricted AFS.
Third, is there actually $69bn of FHLB funding available? At least one Twitter person[74] thinks no, arguing that “FHLB system isn’t built for these behemoths that are…larger than the FHLB”. While this anon provides no additional context, I don’t think this risk should be outright dismissed. Silicon Valley Bank was unable to tap its full FHLB borrowing capacity for reasons I don’t fully understand. Given the relentless outflows at SVB, maybe the FHLB concluded that lending to them was a lost cause.
To be on the safe side let’s assume that, contrary to Schwab’s disclosures, none of the remaining $69bn of FHLB advances are available and that this year the company is met with a gargantuan $100bn of outflows, nearly 30% of their year-end deposit base. After eating through $40bn of cash and $22bn of short-dated govies, Schwab would need to sell ~$40bn of AFS securities with 1+ year maturities to meet remaining redemptions. The unrealized losses on the full $123bn of >1-year AFS securities was about $12bn at year-end, but let’s say those mark-to-market losses have since widened to like $15bn, or ~$11bn after-tax. In this scenario, Schwab would realize about ~$4bn of a/t losses on its $40bn AFS liquidation. With $100bn of deposits and assets now off the balance sheet, Schwab’s Tier 1 Leverage ratio improves from 7.2% to 8.6%, leaving about $17bn of capital cushion, enough to absorb the ~$4bn of realized losses from the AFS sales, even without taking into account the, say, ~$6bn-ish of pro-forma earnings that would flow into retained earnings throughout the year.
But what amount of outflows can we reasonably expect? Schwab has $17bn of outstanding loan balances that come due after June and, more importantly, X% of $367bn of bank deposits that will cash sort out of the bank and into higher yielding alternatives, either out of fear or greed. What is X?
Well, since cash sorting responds to changes in the Fed Funds rate, it should not come as too big a surprise that Schwab’s bank deposits declined by $77bn ($444bn → $367bn) from 2021 to 2022, as the Fed took rates from 0 to 4%+, the fastest pace of hikes in 40 years.
What Schwab has observed throughout its history, though, is that cash sorting settles down as rate hikes cease. Clients want to maintain some minimum amount of transactional cash in their accounts. Whether starting with high levels of cash or low levels of cash, they all converge toward an “equilibrium” level.
According to Schwab, the above analysis was done “across 30 different wealth tiers, across 5 different client segments and the pattern is exactly the same”. On their Jan. 27 earnings call, management claimed they were in the “later innings” of the cash sorting cycle and that the cash they were getting from new accounts was offsetting “any lingering sorting activity” from existing accounts. All this is just to say that if Fed Funds goes from ~4.5% to, let’s say ~5%-5.5% this year, it would be quite surprising to see the same ~$77bn of cash sorting deposit outflows that Schwab experienced in 2022, when rates exploded from 0% to over 4%….and needless to say, the Fed is almost certainly re-evaluating its hawkish posture in light of SVB’s failure and the ensuing anxiety.
So if this were just about run-of-the-mill cash sorting, I think Schwab could cover deposit outflows under any reasonable bear case scenario. But with Silicon Valley Bank now defunct, things have changed. From a liquidity standpoint, I think Schwab is in a much stronger position than SVB or even First Republic for that matter. Whereas uninsured deposits – that is, deposits exceeding the FDIC insurance threshold and therefore most likely to flee in a panic – comprised an estimated 94%(!) and 67% of SVB and FRC’s total deposits, respectively, at year end, they made up just 21% of Schwab’s. Plus, cash and readily salable AFS securities cover the near entirely of Schwab’s uninsured deposits. The same cannot be said of SVB and FRC.
But anxiety is contagious. You can imagine: someone reads about the SVB collapse, sees that Schwab’s stock is down a lot, assumes something must be seriously wrong there too, and pulls their cash from Schwab bank into T-Bills, forcing more liquidity pressures that push the stock lower, etc. in a reflexive doom loop. In 2022, cash sorting was provoked by rate hikes so rapid that even as bank deposits declined by 17%, net interest income still grew 33%. This year though, if cash sorting is motivated by fear rather than greed, a similar level of outflows would not be accompanied by higher rates. Moreover, FHLB advances are expensive. At year-end, Schwab was paying 4.9% on outstanding balances. If $50bn of ~0% deposits are replaced with 5% FHLB advances (assuming that’s even possible), we’re talking about an incremental ~$2bn hit to after-tax earnings per year on a current run-rate base of $8bn. In short, even if a mass outflow of deposits doesn’t impair capital it may drive earnings lower until people calm down, at which point fear-driven cash sorting is reversed and fresh deposits can be put to work at today’s higher rates. If liquidity concerns prove to be a hiccup and things go back to pre-SVB days in short order, I think there’s a credible path to $6-$7 of per share owners’ earnings (that is, earnings after the incremental capital has been posted to support asset growth) in 5 years. At 20x + accumulated dividends, you’re looking at ~18%-20% returns off the current price ($59).
I admit to being wary about publishing this post, as the reputational damage of being wrong on something like this far exceeds the benefit of being right. If Charles Schwab’s bank teeters into receivership, it will be one of the biggest financial events in years and anyone who suggested that failure was unlikely will be dog-piled with told-ya-so’s. If it turns out that Schwab is fine and the stock recovers to ~$75+, people will shrug and move on with their day.
Let me be clear. While I think it would take a colossal outflow of deposits – something well north of $100bn – to take Schwab down, it would be foolish to deem this scenario impossible given the stench of panic pervading the air. It’s human nature to extrapolate what’s happening today further into the future than is warranted and sometimes this tendency can be profitably faded. But this approach can fail horribly when public confidence itself is an input to intrinsic value, as it is with banks.
A public service announcement is warranted here. My memories of the GFC are all too vivid. I remember bank CDS, quoted in single digit basis points just a year ago, being traded for points up front. I remember puzzling over how to dimension liquidity needs, how big a capital crater subprime CDO exposures might leave, and how much, if any, government support would be available. I remember reasonable-sounding write-ups (like this one!) invalidated within days. I remember an otherwise stolid co-worker pushed to tears by the emotional strain of an especially harrowing week. I wish this on no one. If you think this could be you, maybe just $CSU and chill (not investment advice!).
On Twitter, comparisons between the GFC and what’s happening today have been rightly poo-poohed. Back then, major banks were holding toxic assets on razor thin capital bases. Valid solvency concerns fed into liquidity strains. The term “other-than-temporary-impairments (OTTI)”, where impairment charges are taken on securities whose fair value is not expected to recover to par, was on the tip of everyone’s tongue in 2008. Nobody is using it today because credit quality is not a core issue. But what both periods have in common is fear, and fear doesn’t dispassionately ask whether your securities are par paper, nor does it wait for earnings to leisurely bleed into capital. It punches you in face as it darts for the exit.
(special thanks to @willis_cap[77], who went back and forth with me on Schwab throughout the weekend while he was on vacation in Hawaii and offered helpful suggestions to this write-up)
Disclosure: At the time this report was posted, accounts managed by Compound Insight LLC owned shares of SCHW. This may have changed at any time since.
quick follow-up on Charles Schwab
Posted By
scuttleblurb
On
In
SAMPLE POSTS,[SCHW] Charles Schwab |
No Comments
the media rarely lies explicitly and directly. Reporters rarely say specific things they know to be false. When the media misinforms people, it does so by misinterpreting things, excluding context, or signal-boosting some events while ignoring others, not by participating in some bright-line category called “misinformation”.
I was reminded of this phenomenon over the last few weeks after reading much of the commentary about Charles Schwab. Most of the long-form Schwab write-ups and Schwab-related tweets I read made the same point: marking all of Schwab’s securities to fair value wipes out nearly all of its tangible book value. This is factually true. The authors are not lying. But they are “misinterpreting things” and “excluding context”. As I hope I made clear in my last Schwab write-up, you can’t express a view on solvency without expressing a view on cash sorting. If no depositors cash sort out of the bank, then Schwab’s investment securities, predominantly Treasuries and Agencies, will pull to par as they mature and everything is fine. If all depositors cash sort at once, then Schwab Bank will be forced crystallize all its unrealized losses and find itself in ruin.
If you want to say “scuttleblurb, you’re delusional. I think Schwab will have to tap into the HTM bucket as 80% of deposits flee and (for whatever reason) liquidity backstops are unavailable, which in turn will convert huge unrealized losses into realized losses, impair their capital ratios, and either force them into receivership or into raising boatloads of capital on massively dilutive terms“, that’s great! This is the right framework for thinking about insolvency in this particular case.
Of course, I thought the chance of an SVB-style debacle was very low (say, less than 3%) at the time of my last post and I think the probability is even lower now with the Fed’s the Bank Term Funding Program (BTFP)[80] in place. The BTFP lets Schwab and other federally insured banks to access funds against the par value of Treasury and Agency collateral. The advances will be made available for a term of one-year at a rate of ~5%17[81].
The day after the BTFP was announced, Schwab released its monthly Activity Highlights[82], which included the following statement:
We have access to significant liquidity, including an estimated $100 billion of cash flow from cash on hand, portfolio-related cash flows, and net new assets we anticipate realizing over the next twelve months. We believe we have upwards of $8 billion in potential retail CD issuances per month, plus over $300 billion of incremental capacity with the Federal Home Loan Bank (FHLB) and other short-term facilities – including the recently announced Bank Term Funding Program (BTFP).
To briefly recap, at year end Schwab’s immediate sources of funds included:
Cash: $40bn
AFS govies maturing in < 1 year: $22bn
Other AFS-securities: $123bn
On top of all that, they can now tap into $176bn of funding by posting HTM securities, all US agency MBS, to the BTFP.
That’s more than $300bn of liquidity against Schwab’s $367bn of total bank deposits, only $73bn of which is uninsured. In an interview with The Wall Street Journal[83] last Thursday, CEO Walt Bettinger affirmed, “There would be a sufficient amount of liquidity right there to cover if 100% of our bank’s deposits ran off,”….“Without having to sell a single security.” So the risk of a catastrophic liquidity strain that tips Schwab Bank into receivership seems very very low. And in the unlikely event that half of total deposits cash sort out of the bank and Schwab is forced to liquidate all its AFS securities, its Tier 1 leverage ratio would actually improve (from 7.1% to 8.1%): the excess capital released as the balance sheet shrinks exceeds the after-tax value of realized losses on the AFS securities being sold.
But even if Schwab can survive a deposit run, it still faces an earnings challenge. The most vigorous proponents of this view are puzzled that anyone would keep brokerage cash in deposits earning ~0% when they could, with just a few clicks, invest that cash in one month T-bills earning ~4%. The pace of rate hikes is like nothing we’ve seen in the last 40 years and with broad public awareness of inflation and rates, the consumer is likely far more sensitized to rate hikes today than they were during the far more measured rate hiking cycle of 2015-2019, which management often points to as a comp for cash sorting dynamics.
Moreover, while 80% of Schwab’s deposits are FDIC-insured and come from 34mn brokerage accounts that represent a wide cross section of the US mass affluent – making them far more diversified and stable than SVB’s, which were concentrated in the accounts of cash burning startups funded by herdlike VCs with Twitter megaphones – they are also qualitatively different from primary checking accounts that consumers use for day-to-day purchases. I suspect that the brokerage account clients that own these deposits and the RIAs who manage half of Schwab’s clients’ assets are more attuned to visible and easily attainable sources of incremental yield than the average depositor at some regional bank.
On the other hand, brokerage clients will typically maintain some minimum amount of transactional cash in their account – either out of inertia or maybe just to yolo into GameStop or whatever at a moment’s notice – so cash sorting should diminish as cash balances decline. At year-end, the average Schwab brokerage client had just under ~$15k of sweep cash in their account (down from ~$18k the year before)18[84]. That’s about 7% of their Schwab assets. Maybe clients now feel compelled to shove a big part of that residual 7% cash allocation into T-bills to juice returns. But then again maybe the average Schwab brokerage client is not as conscientious about optimizing yield as you are.
Several readers replied to my last post with something along the lines of “even if solvency risk is off the table, with rates where they are, cash sorting will be a big headwind to earnings”, as if I disagreed. I don’t. The thesis here turns on the degree and persistence of cash sorting from current levels.
(Update – 3/26: in the original post, I used changes in avg. interest-earning assets as a rough proxy for changes in deposits. This was too noisy to be useful, especially over very short time periods like 2 months, so I deleted it. Doesn’t change the analysis. I was basically trying to get at a reasonable base assumption for changes in bank deposits in 2023 in the lead up to my bear case scenario.)
Again, this doesn’t mean that cash sorting is over (no one’s saying that, not even management), just that the degree of cash sorting diminishes as rate hikes moderate. In its monthly activity statement published March 13, following a week where everyone was freaking out over SVB contagion risk, management backed up this point with some data:
Client bank sweep cash outflows in February were about $5 billion lower than January and March month-to-date daily average outflows are tracking consistent with February. Importantly, these outflows reflect a continuation of client decisions to reallocate a portion of their cash into higher yielding cash alternatives within Schwab. Based on our ongoing analysis of these trends, we still believe client cash realignment decisions will largely abate during 2023.
Over the following days, insiders bought a ton of shares:
Source: BAMSec
I can’t remember the last time I saw so much widespread insider buying in such a short window of time. Given that banking is ultimately a confidence game, it’s possible these purchases were coordinated to signal conviction even as the underlying business deteriorated far more than management anticipated, but that’s a pretty cynical read.
But one need not be cynical to be bearish. In this anxious time, hawkish Fed behavior may carry disproportionate weight given all the attention on bank balance sheets. So let’s go a little nuts with the cash sorting and say that with the Fed rate hiking by 50 bps this year19[85] deposits fall by 41% from year-end levels, or $150bn. That’s close to twice the net outflows that Schwab experienced last year, when rates moved from 0% to 4%+. Let’s further grant that all deposit outflows are moved into T-bills and nothing is diverted to investment vehicles where Schwab earns management fees.
In this bear case, I also assume the following:
1) the bank balance sheet never grows again
2) cash sorting outflows are funded with $40bn cash, $22bn of short-term govies, $70bn of AFS liquidations, and $18bn of BTFP/FHLB funding
3) client assets continue to grow by ~5%/year. If you’ve followed Schwab for a while you know that this company metronomically grows client assets by 5%-7%. The banking drama unfolding over the last 2 weeks hasn’t changed that. In their March 13 monthly activity statement[86], Schwab reported:
February core net new assets totaled $41.7 billion, our 2nd largest February ever (trailing only February 2021, the height of the meme stock craze). Our growth and momentum have continued into March, with daily net new assets averaging nearly $2B per trading day month-to-date.
The Charles Schwab Corporation today announced it has seen strong inflows from clients over the last week. Over the past five trading days (3/10/23-3/16/23), clients have continued to bring assets to Schwab, with approximately $16.5 billion in core net new assets for the week, demonstrating the trust clients place in Schwab.
So let’s say Schwab’s asset management fees, trading and “other” revenue grow in line with client assets, by 5%/year.
4) As a standalone company, TD Ameritrade earned “Bank Deposit Account” fees on the client brokerage cash it swept into TD Bank. Post-acquisition, these BDA balances, which totaled $127bn at year-end, will migrate to Schwab’s balance sheet at a pace of ~$10bn a year until they are reduced to $50bn. On the transferred deposits, the 1% fees it loses on BDA balances is more than made up for by the incremental profits in gains reinvesting those proceeds at higher yields. This was the biggest source of projected revenue synergies at the time of TDA’s acquisition. In this scenario, I assume BDA balances decline along with Schwab’s deposit balances, by 41% this year. And going forward I assume transferred BDA balances, instead of moving to Schwab Bank, are parked in T-Bills.
5) Last year, with the Fed raising from 0% to 4%, Schwab’s deposit rate moved from ~0% to 0.46%. I assume that this year the rate Schwab pays depositors doubles, from 0.46% to 1%.
There are several important earnings offsets to this sorry state of affairs.
First, in response to a 40% decline in net interest income that takes total revenue down 21%, I assume Schwab cuts 5% of its expense base and grows that base by 2/3 the pace of revenue growth thereafter.
Second, I estimate that Schwab still has ~$600mn of cost synergies and (conservatively) ~$600mn of non-BDA revenue synergies remaining from the TDA acquisition.
Third, even after crystallizing losses on $70bn of AFS securities to meet outflows, Schwab is more overcapitalized than it was before, with a Tier 1 Leverage ratio of 8.2%. They could liquidate and realize losses on the remaining $53bn of AFS securities, reinvest the proceeds at significantly higher yields, and still be above their year-end 7.1% ratio (and well above the 5% minimum ratio set by regulators).
Fourth, with the bank balance sheet no longer growing, Schwab doesn’t need to post incremental bank capital.
When I account for these moving parts, it looks like Schwab is doing about $5.7bn of after-tax earnings in year 5 (down considerably from its current ~$8bn run-rate). In the terminal year Schwab is growing revenue by ~2% and earnings by ~3% (more like 4% and ~5%-6%, respectively, if you look past the steady BDA fee decline). At 12x + accumulated earnings + excess bank capital20[88], Schwab is valued at ~$52/share in year 5, or ~$35 in present value terms, assuming an 8% discount rate (-34% from today’s price of $53). At $53 the stock appears to be pricing in ~$80bn of deposit outflows, followed perpetual bank stagnation21[89].
Anyway, at a high level what my bear case is saying is that Schwab emerges from this cash sorting cycle a shadow of its former self. Interest earning assets decline by 26% this year and never recover while the spread between what Schwab earns from its investments and pays to its funding sources compresses by 25%, from 2.24% in 4q22 to 1.69%.
I think the chances of this scenario playing out are pretty remote, like less than 10%. Cash sorting will eventually settle down somewhere and the enormous ~$400bn+ of net new assets that flow into Schwab every year like clockwork supplies a natural tailwind to deposit growth. Even if just 5% of net new client assets are swept into bank deposits (compared to 7% of total client assets today), that’s still an additional ~$20bn being put to work every year at juicy incremental spreads. Plus, nearly all of deposits that leave Schwab Bank still remains within the broader Schwab complex and surely some portion of that will find its way to fee-generating investment vehicles.
But my toy bear case scenario, despite its inevitable flaws, is still useful for getting a rough sense of how bad things could get, even if Schwab turns out to be fine from a liquidity/solvency standpoint. When a company might be a good investment but there is a thick fog around earnings power, establishing some semblance of a floor can give you a sense of where it might make sense to add. I have a few points of dry powder with Schwab’s name on it in case the stock trades down to like $40s (though I often change my mind and if the stock trades down to $40 for fundamental reasons that undermine my confidence, all bets are off). But I have no more Schwab appetite beyond that. In truth, as interesting as Schwab looks to me at current prices, I will never size this up to double-digits because…well…see all the caveats in my first post. Most banks are mediocre investments most of the time but if you absolutely must own one, consider John Hempton’s rule[90] about averaging down.
Disclosure: At the time this report was posted, accounts managed by Compound Insight LLC owned shares of SCHW. This may have changed at any time since.
A tour through payments: part 1 (Visa and Mastercard)
Posted By
scuttleblurb
On
In
SAMPLE POSTS,[MA] Mastercard,[V] Visa |
No Comments
I plan to spend the next month re-surveying the payments landscape, mostly updating my views on companies I’ve discussed in the past but also maybe laying some groundwork on a few new names. The next few posts will be a loosely organized jumble of thoughts. I don’t know where this is going or how it will end but I know where it should start: with the two dominant global card networks, Visa and Mastercard, which I’ve written about several times in the past and have owned on and off over the years.
Like some other companies that have held their market values this year, Visa and Mastercard are competitively entrenched cash gushers with secular tailwinds that have so far been unscathed by the macro. Cross-border volumes, which are far more profitable than domestic switching given currency translation fees and lower rebate burdens, have ricocheted back stronger than anyone expected, to about 40% above pre-COVID levels. With most of their revenue tied to payment flows, the card networks are also net beneficiaries of inflation. Over the last 3 years, Visa and Mastercard have grown EBITDA by 9% and 11%, respectively, even with Russia revenue (4% for both) reduced to 0, and I think there’s plenty of reason to think profits will continue to grow at a similar rate for the foreseeable future.
Rather than expound upon Visa and Mastercard’s moats, which are widely understood and appreciated by now, I thought it’d be more useful to discuss potential challenges. This is conviction by subtraction, seeing how much is left after chipping away the excess stone of competitive threats.
Digital Wallets
When I first began looking at Visa and Mastercard in earnest in 2016, the most salient bear case was that digital wallets would eventually disintermediate card rails. Someone like PayPal could encourage users to directly link bank accounts to their wallets, which could then be used to transact with a PayPal-accepting merchant, creating a closed transaction loop that bypassed Visa and Mastercard. And indeed, to avoid interchange fees, PayPal encouraged this behavior in its early days. Then in 2016, with customers complaining about being defaulted to ACH, PayPal agreed to present V/MA credit and debit as “clear and equal” payment instruments inside the wallet (”Customer Choice”)22[91]. This landmark announcement preceded a flurry of integrations with digital wallet integrations all around the world.
Today every major digital wallet and bank I can think of – including Cash App, PayPal, Apple, Venmo, Grab Pay, MercadoPago, Monzo, etc. – embeds or issues Visa or Mastercard credentials. It’s easy to see why. Consumers want the assurance of knowing they can spend at just about any merchant around the world, online and offline, and earn interchange-funded rewards along the way. A digital wallet that didn’t plug into card rails would soon find themselves at a steep disadvantage to competing wallets that did.
With few exceptions, the relationship between the card networks and digital wallets is a symbiotic one. Visa and Mastercard, with their combined ~170mn merchants, enable immediate global acceptance that results in lower churn, larger order values, and more profit dollars for digital wallets. In turn, digital wallets, with their direct consumer relationships, expand distribution for card networks. Far from being a critical point of integration sweeping value away from card networks, fintechs have pulled more transaction activity onto them.
Buy Now Pay Later (BNPL)
In a BNPL-funded purchase of, say, a $1,000 sofa, the BNPL provider will pay ~$950 to the merchant and keep ~$50 for itself, then collect 4 separate $250 payments from the shopper over 4 weeks or whatever. So this is technically a loan, but as I explained in a previous post:
… the easier BNPL is to use and the more ubiquitously adopted it becomes, the more it behaves like a payments network than it does a loan (unlike traditional lenders who live on net interest income, the vast majority of BNPL revenue comes from merchant fees). The more checkout pages that support Affirm the more useful it is for consumers, and a shopper who signs up for Affirm at one merchant will start using it at other merchants too. The more transactions a BNPL facilitates, the more SKU-level and repayment data they have to underwrite risk and offer a greater variety of payment options to consumers at checkout (in contrast to credit cards, which offer blunt homogenous credit terms across all purchases), fueling conversion gains and merchant adoption.
You can see how in theory the mechanics of BNPL could spool up to a competing payment network. Last year Alex Rampell, a General Partner at a16z, who set out to explain why BNPL was “an early threat to trillions of dollars of market cap – Visa (almost $500B), MasterCard ($350B), card issuing banks, acquiring banks/services (Fiserv, FIS, Global Payments, etc)?”, gushed:
But this isn’t entirely accurate. Card networks profit from BNPL in a number of ways.
First, more than 80% of BNPL installments are repaid with debit, and thanks to fixed per-transaction fees, Visa and Mastercard make more from 4 separate $250 payments than from a single $1,000 payment.
Second, BNPL providers are now using virtual cards (a single use card for a specific amount) to settle with merchants. The way this works is inside the Affirm app, a user can load a Visa virtual card for some arbitrary amount, spend that sum at any Visa-accepting merchant, and pay off the balance over time (see the illustration below):
Consistent with Visa and Mastercard’s position as a platform that other fintechs build upon, any qualifying bank and fintech can leverage Visa and Mastercard open loop BNPL capabilities. Open BNPL is early but catching on, with Visa recently reporting triple digit volume growth and Affirm’s virtual card revenue accounting for 18% of revenue, up from 12% a year ago. The reason that BNPL fintechs with putative schemes to disrupt traditional card rails are partnering with them instead is pretty simple: widespread merchant acceptance. Compared to Affirm and Klarna, who combined are embedded at checkout at ~700k merchants, Visa and Mastercard are accepted by 170mn. Rather than piecemeal integrate with merchants, fintech BNPLs can partner with Visa and Mastercard and reach immediate global scale.
Admittedly, pre-loading a virtual card isn’t as seamless a user experience as having it available at online checkout. And in the case where a consumer BNPLs with Affirm at checkout and repays with ACH, the card networks are indeed obviated. But in the increasingly common scenario where the BNPL provider settles with the merchant through virtual cards and the consumer pays off BNPL balances with debit, Visa and Mastercard make money twice on the same purchase. As with digital wallets, BNPLs may ultimately reinforce rather than disintermediate the card networks.
I’m not nearly as bearish on the concept of BNPL as many others. There’s a place for it. But I also see BNPL less as something to build a company around (AfterPay shareholders were indubitably bailed out last year when Square agreed to acquire the company for an absurd 40x revenue) than as yet another feature nestled inside the portfolio of a larger financial concern. PayPal has 35mn merchants in its network and claims it can underwrite to higher acceptance and lower loss rates by virtue of having a pre-existing relationship with 90% of its BNPL users. In less than 3 years since launch, it has become the largest player in the space. Banks, meanwhile, have an entrenched customer base and can fund loans with sticky low cost deposits. By contrast, standalone BNPLs looking to bypass Visa and Mastercard have just a fraction of the merchant base to build off. And to fund receivables, they rely on securitizations and forward flow agreements, whose availability and cost is subject to market conditions.
Crypto
For purposes of this discussion, we can segment the universe of digital assets into: cryptocurrencies with no fiat backing (Bitcoin, Ethereum), private stablecoins (Tether, USDC), Central Bank Digital Currencies (China’s e-yuan; The Bahamas’ sand dollar), and non-fungible tokens (Cryptopunks, Bored Apes). Visa and Mastercard touch all these categories. Their rails serve as “on-ramps” to purchase Bitcoin, NFTs, and other crypto assets on Coinbase and other crypto exchanges and, with practically no merchants natively accepting crypto of any kind as a form of payment, as “off-ramps” from the self-contained crypto universe to the real world. For instance, when a Coinbase customer uses their Coinbase debit card to purchase a cup of coffee, Visa will convert some of the customer’s Bitcoin (or Ethe or Dogecoin) to a government-backed fiat currency that Starbucks can actually accept. Finally, when it comes to CBDCs – digital tokens issued by a central bank – Visa and Mastercard will directly settle those just as they would any other government-backed fiat currency.
The profusion of frauds and collapsing crypto prices has deflated the crazed optimism that once characterized this space. Visa and Mastercard didn’t get the memo. They’re still talking about cryptocurrencies and NFTs like its 2021. But I doubt they care as much about crypto as the skeptics and optimists who have been emotionally hijacked by it over the years. V/MA see themselves as payments infrastructure and are philosophically agnostic to whatever form factor payments take, as they should be. You can be cynical about the whole crypto complex and still agree that Visa and Mastercard should lay the groundwork for playing a role in it. There is no contradiction here. In owning ubiquitous payment infrastructure, the card networks can absorb frontier payments technologies without bearing much risk, adjusting their investment based on how things play out. In fact, it would be worse if the card networks took the strong dogmatic view that all this crypto stuff is garbage and ignored it completely, not because crypto is the next big thing but because that reactionary attitude would likely extend to other domains of innovation that may seem dumb and insignificant at first but prove worthwhile after all.
I could see stablecoins being used for certain big ticket cross border B2B, or for remittances and as a store of value in countries plagued by hyperinflation and corrupt authoritarian regimes. For those privileged enough to be living in stable liberal democracies with strong institutions and mature banking systems, crypto can do some of what the tradfi apparatus does, but it does those things much worse. It is slower and more cumbersome. The irreversible transfer of value is a bug, not a feature, in retail transactions. In the unlikely scenario that stablecoins find broader acceptance as a directly settled currency, there will likely be a long transition period where those coins must be converted to fiat to be useful and the globally ubiquitous card networks already do something similar in converting one fiat currency to another for cross-border transactions. Moreover, as Visa likes to point out, even a popular stablecoin like USDC runs on 8 different blockchains. The card networks are well placed to integrate across them, in much the same way they function as a hub across different fiat payment rails today.
As for CBDCs, assuming the end state isn’t a Soviet-style Gosbank[93] that crowds out commercial banks, we’re probably looking at some kind of public-private hybrid – with private banks handling KYC, lending, account maintenance, and other consumer-facing functions and central banks controlling the supply of digital money and financing commercial banks’ lending activities (consumer deposits would technically sit on the central bank’s balance sheet, not the commercial bank’s) – that from the consumer’s perspective largely resembles what we have today, in which case the current card networks probably remain intact, settling CBDCs like any other fiat. But I frankly don’t see the point of CBDCs, at least in the US. Americans trust that funds deposited at commercial banks are secure thanks to capital requirements, deposit insurance, and liquidity facilities backed by the Fed. And there just doesn’t seem to be enough friction in payments and access to banking services to warrant such a radical departure from the status quo.
Real-time payments
The perennial bull case for Visa and Mastercard is that their networks will capture a growing share of payment flows as electronic payments replace cash and checks. But card networks aren’t the only winners. A number of government backed real-time payment (RTP) networks, which facilitate the transfer of funds from one bank account to another in real time 24/7, has launched over the last 7 years. There are a few dozen scattered throughout the world today:
In most countries, RTPs have mostly been relegated to P2P transfers, bill payments, and B2B. But there are several notable exceptions – The Netherlands, Brazil, and India – where ease of use and commercial bank sponsorship have spurred significant person-to-merchant (P2M) use.
Pix, designed and managed by Brazil’s central bank, has become the most popular form of payment in Brazil, claiming ~30% of the country’s transactions in less than 2 years since launch. It has been used by more than 70% Brazilians, who need only enter a phone number, email address, or taxpayer ID from their banking app or wallet to send payments instantly.
In India, Unified Payment Initiative (UPI), launched in 2016 by the National Payments Corp of India, a non-profit retail payments organization created by the Reserve Bank of India, has exploded in popularity. UPI is the payments layer of the India Stack[99], a massive government sponsored project conceived in 2009 to usher the country’s 1.2bn+ citizens into the digital economy. Over the last 3 years, with its transaction volumes have soaring by 9x, UPI has become the most common electronic payment method in India, accounting for 63% of India’s non-cash transactions23[100]. It claims 41% share of person-to-merchant transaction value (56% by volume[101]), on pace to overtake debit and credit, which still capture 53% of merchant acceptance by value, 26% by volume24[102].
In the US, the Federal Reserve is rolling out FedNow, in mid-2023. Were it to gain the same degree of P2M adoption as iDEAL, Pix, and UPI, FedNow would be very damaging for Visa and Mastercard, who derive 49% and 37% of respective purchase volumes from the US. Whether FedNow comes to claim the incremental flows that otherwise would have been intermediated by Visa Direct and Mastercard Send – schemes that “push” funds from one account to another and power P2P apps like Zelle, Venmo, and Square Cash – remains an open question. But the P2M flows that make up the vast majority of V/MA profits are probably secure. Banks and card networks are just woven too tightly into US payments fabric. FedNow won’t be the first RTP in the US. The Clearing House (TCH), a payments company owned by the largest US banks, launched an instant payments network in 2017 that, despite touching 75% of demand deposit accounts, has gotten close to 0 traction in retail. In the UK, where the card networks are similarly entrenched, Mastercard tried and failed to extend Vocalink to P2M transactions through its Pay by Bank app.
But that still leaves India and Brazil, two countries long hailed by both Visa and Mastercard as growth drivers. For at least the next 5 years, I don’t think there’s much to worry about. “There’s enough TAM to go around” is a tiring cliche but in this case it happens to be true. In Brazil, cash is used in 35% of point-of-sale transactions[103] (compared to 11% in North America); in India, it’s more like 80%.
The rising tide of cash-to-digital payments has lifted all boats. While Visa and Mastercard are less entrenched and face more direct competition in developing economies, those disadvantages have been more than offset by greater gains in per capita spending and electronic payments growth. In Brazil, Visa has doubled acceptance points over the last 2 years and doubled payment volumes over the last 3. India was Visa’s “fastest-growing market in Asia” in 2q22, with payment volumes now 84% above 2019 levels, even as UPI flows have grown at more than 3x the rate of overall digital payment volume over the last 5 years25[105]. Since 2015, Mastercard’s transaction volumes in Asia, Latin America, and the Middle East have grown by ~18%/year compared to ~8% in the US. For Visa, it’s been more like ~14% and ~8%, respectively26[106].
Nevertheless, Visa and Mastercard were unnerved by the long-term threat posed by alternative payment systems and around the time these RTP rails were taking off, both companies began to look beyond card rails and traditional P2M flows. In 2017, Mastercard acquired Vocalink, which runs the UK’s real time ACH infrastructure, and then used Vocalink’s software to power real time rails in Canada, Thailand, Saudi Arabia, Singapore, and the US27[107]. With the purchase of Nets, Mastercard gained access to real-time account-to-account (A2A) in Europe. With Transfast, they acquired payments web that ensnared “90% of the population and over 90% of the world’s bank accounts.[108]” Visa also expanded its network to include cross-border A2A through their acquisition of Earthport, a payments facilitator with direct connections to the local ACHs and RTPs of 88 countries, connecting to 2bn end accounts. Through a partnership with Thunes, a payments platform that connects 78 mobile wallet operators across 44 countries, Visa Direct can reach 1.5bn individual wallets. Today Visa’s “network of networks” include 66 ACH rails and more than a dozen RTPs.
While this was going on, European regulators enforced its Payment Services Directive part Deux (PSD2), mandating that banks expose APIs that grant third party service providers access to customer bank account information (with the customer’s permission, of course). The regulation fueled open banking aggregators like Plaid and Tink that intermediate the flow of data from banks to any number of third party apps. Anticipating a time when open banking networks would also come to handle the movement of funds and challenge debit flows, Visa acquired Tink28[109], the largest financial data aggregator in Europe, while Mastercard purchased US-based Finicity and Denmark-HQ’ed Aiia. For now, open banking is mostly about moving data, not money. For instance, through Plaid, a personal finance app might pull transaction data and savings balances from a customer’s bank account to deliver a personalized budget or a mortgage lender might verify income and assets. Finicity offers credit scoring for bank and fintech partners who use Mastercard’s BNPL. Consumers could increasingly use open banking to pay at online checkout or to fund digital wallets, which can then be used to pay for things, cutting card networks out of the transaction loop entirely. But in both cases you’re still stuck with the problem of merchant acceptance. An new open banking checkout button from Vyne[110] will have to compete with established buttons from PayPal, Amazon, Apple etc., and there’s a reason why just about all major digital wallet have abandoned their closed postures and opened up to the card networks.
Concurrent with their expansion into A2A, both Visa and Mastercard modified their traditional card rails to accommodate “push” transactions – so whereas in a traditional card transaction, the merchant “pulls” funds from the consumer, with Visa Direct and Mastercard Send, payments can be pushed from consumers to consumers, from Allstate to policyholders, from Uber/Lyft to drivers, from Square to merchants, from businesses to employees seeking paycheck advances.
By integrating their card networks to alternative rails, Visa and Mastercard have positioned themselves as a global payments router, replacing unwieldy bilateral connections with a single hub that spokes out to billions of bank accounts and card credentials, accommodating a wide range of different payment flows: P2B, B2B, and P2P via card-to-account, account-to-account, and card-to-card.
Source: 2020 Visa Investor Day
Whereas Visa and Mastercard span the globe, government-sponsored instant payment rails are for the most part only useful for domestic transactions. A Brazilian can’t use Pix to subscribe to Spotify or purchase a handbag in Singapore. In theory, countries could solve the cross-border problem by integrating their RTPs, but in practice this hasn’t worked out. Europe has been trying to create a pan-European payment system for more than a decade. The Monnet Project Association was shuttered less than 4 years after it was conceived in 2008 after the European Commission refused to approve the interchange rates that member banks believed were necessary[111] to make MP commercially viable. The European Alliance of Payment Schemes (EAPS) and PayFair also folded. The European Payments Initiative (EPI), conceived in 2020, was abandoned by more than half its member banks earlier this year. Meanwhile, in Southeast Asia, the vision of a cross-border multi-lateral hub – first instantiated in the central-bank backed Asian Payment Network in 2006 – has given way to bespoke bilateral integrations[112] (Singapore’s PayNow ↔ Thailand’s PromptPay; Thailand’s PromptPay ↔ Malaysia’s DuitNow, etc.). Given how hard it’s been for even regional RTP initiatives to get off the ground, it seems farfetched to think that dozens of siloed RTPs across the world will agree to common standards, either through a series of bilateral arrangements or a common global hub.
The other way card networks are protecting themselves from competing networks is by climbing up the payments stack. “Value-added services” have long been a part of Visa and Mastercard’s offerings, but up until about 6-7 years ago they were a side show that existed as an outgrowth of the core processing business and in service to it. For example, leveraging enormous mounds of proprietary spend data, the card networks help merchants and issuers detect fraud. They also offer marketing and business intelligence services that, for instance, can show a large fast food chain how much share they’re taking in a certain market compared to peers and how much of their spend comes from foreign card holders; or, for a card issuing banks, which rewards programs are resonating with customers or how their card programs rank in terms of spend or retention relative to peers. Visa and Mastercard compete fiercely for the business of card issuers, especially that of large money centers like Bank of America and Citigroup – the incentives offered to card issuing banks have climbed dramatically as a percent of gross revenue over time – and will use VAS as a carrot to retain them or to secure new card programs in lieu of incentives.
As the #2 player trying to differentiate and gain ground on its larger rival, Mastercard has been more tech-forward and earlier to explore fintech partnerships. They also placed more emphasis on services. With nearly every Mastercard issuer adopting at least one of its services, VAS accounts for 35% of revenue today (growing 25%+), up from mid-teens in 2012. But over the last few years, with intensifying competition from competing rails, Visa too is talking a big services game29[113]
Whereas both companies once bound services to their card rails, they now treat it as a modular component that can be carried to competing rails. For example, with Token ID, Visa is applying tokenization30[114], which drives higher authorization and lower fraud rates, to RTP and ACH, with TCH recently adopting this capability (you’ll recall that TCH’s RTP is powered by Vocalink, which is owned by Mastercard). Visa Advanced Authorization, once available exclusively to Visa issuers, is now being extended to merchants to detect fraud on e-commerce transactions, including transactions running on competing networks. Last year Visa rolled out a crypto consulting and analytics practice to help banks formulate crypto strategies (whatever that means). Mastercard’s rail agnostic services include ID authentication for transacting users (Digital ID, built on its $850mn acquisition of Ekata) and solutions that make it easier for consumers to pay bills and for small businesses to pay vendors, with all the reconciling data and documentation attached. Naturally they also have a crypto consulting business to help central banks design CBDCs.
So these value added products serve both an offensive and defensive purpose. They improve issuer retention and allow V/MA to extract more value from their entrenched card rails. But as payment flows extend beyond P2M, and as governments, especially those in countries whose payments industry hasn’t matured alongside a 4-party card system, roll out their own RTPs, a growing share of the ongoing cash-to-digital migration could be captured by competing domestic rails, in which scenario Visa and Mastercard can maintain relevance by supplying the technology that renders those rails more useful and secure.
Regulation and perception
Like any globally dominant American company, Visa and Mastercard are greeted with varying degrees of circumspection by foreign governments who would prefer their critical infrastructure be locally owned. In the extreme, foreign card rails are blocked from domestic switching, as in China and Russia. But even without outright banning Visa and Mastercard, governments can still exercise soft power by promoting local schemes. In India, Rupay – the local card scheme launched in 2012 by a consortium of major banks, some state owned – has captured the highest share of debit and credit cards, prompting one senior Visa official to remark[115]:
“The only reason RuPay has added so many is not because it is cheaper, but because there is an invisible mandate from the government to issue only RuPay cards. More than half of the cards issued have not been used. NPCI can claim to issue millions of cards. But these cards are not as a result of competition, but due to a monopoly.”
…U.S. government memos show Visa raised concerns about a “level playing field” in India during an Aug. 9 meeting between U.S. Trade Representative (USTR) Katherine Tai and company executives, including CEO Alfred Kelly.
“Visa remains concerned about India’s informal and formal policies that appear to favour the business of National Payments Corporation of India” (NPCI), the non-profit that runs RuPay, “over other domestic and foreign electronic payments companies,” said a USTR memo prepared for Tai ahead of the meeting.
Yet, even with 60% share of issued cards[117] as of 2020 (up from 15% in 2017), Rupay handles less payment and transaction volume than Visa and Mastercard combined. The disparity comes from the fact that credit cards account for a disproportionate amount of spend – credit volumes exceed debit volumes despite accounting for just 10% of total cards issued – and are predominantly issued to higher income consumers, where Visa and Mastercard have 70% share[118] compared to Rupay’s 20%[119]. So while India is contributing less to V/MA’s payment flows than it otherwise would absent government-backed competition (UPI and Rupay), with cash giving way to electronic payments and consumer credit adopted by a growing middle class, the country is still additive to the card networks’ overall growth.
In the US, regulation hasn’t been nearly as heavy-handed, though the rationale behind it is less straightforward and arguably more disingenuous. The latest legislative proposal, Card Competition Act of 2022[120], introduced by Senator Dick Durbin, prohibits banks with more than $100bn of assets from restricting the processing credit card transactions to Visa and/or Mastercard’s network. This means merchants can route Visa and Mastercard credit transactions on competing rails, introducing more competition among credit card networks that will translate to lower interchange fees for merchants. The CCA builds upon the Durbin Amendment of 2011, which you may recall cut debit interchange for certain transactions from ~1.55%-1.6% + 4c/5c to 0.05% + 21c, reducing interchange fees per covered transaction by 45%[121] on average.
Opponents of the V/MA duopoly will indignantly emphasize the huge gross dollar sums paid to banks and card networks, like: “Merchants paid $64 billion[122] in interchange fees just to Visa and Mastercard in 2018” (The Week[123]); “In 2021 alone, U.S. merchants and consumers paid nearly $138 billion in card fees” (Merchant Payments Coalition[124]); and “Swipe fees big banks charge merchants to process credit and debit card transactions totaled nearly $138 billion last year. That’s 10 times North American movie theater box office receipts in pre-pandemic 2019 and 2020” (The Topeka Capital Journal[125]). But of all the pro-merchant, anti-V/MA commentary I’ve read, I have yet to find one that mentions the obvious: that nearly all interchange fees go to preventing fraud, servicing cardholders, and subsidizing consumer rewards.
Dick Durbin thinks[126] “credit card swipe fees inflate the prices that consumers pay for groceries and gas”, which assumes that in the absence of interchange, merchants would pass the swipe fee savings to consumers. But in a 2014 study, the Federal Reserve Bank of Richmond found[127] that the 2011 Durbin Amendment capping debit interchange “has had a limited impact on prices. Averaging across all sectors, it is estimated that the majority of merchants (77.2 percent) did not change prices post-regulation, very few merchants (1.2 percent) reduced prices, while a sizable fraction of merchants (21.6 percent) increased prices”. Moreover, a 2014 study published by the Federal Reserve Board[121] concludes “that covered banks increased their deposit fees in response to the [Durbin Amendment]. While these increases are generally insufficient to mitigate all of the lost interchange income, changes in deposit fees offset roughly 30 percent of the lost interchange income”. A 2019 study published by the University of Pennsylvania Carey Law School[128] goes even further:
we find significant evidence of banks offsetting Durbin losses by raising other account fees. The share of free basic checking accounts (accounts with a $0 monthly minimum for all customers, regardless of account balance) decreases from 60 percent to 20 percent as a result of Durbin. Equivalently, average checking account fees increase from $4.34/month to $7.44/month. Monthly minimums to avoid these fees increase by around 25 percent, and monthly fees on interest checking accounts also increase by nearly 13 percent. A rough back-of-the envelope calculation suggests that banks make up approximately all Durbin losses. These higher fees are disproportionately borne by low-income consumers whose account balances do not meet the monthly minimum required for these fees to be waived.
And despite some caveats:
we can conclusively show that consumers experience immediate Durbin losses through higher bank fees, and we find limited evidence in the gas industry for across-the-board consumer gains through significantly lower merchant prices.
Likewise, in Australia, where the Reserve Bank of Australia cut credit interchange from 0.95% to 0.55% in 2003 and slashed Visa debit interchange31[129] from 0.53% to 12c per transaction in 2006, the consulting firm Charles River Associates found[130] that the “regulations have clearly harmed consumers by causing higher cardholder fees and less valuable reward programmes and by reducing the incentives of issuers of four-party cards to invest and innovate. At the same time, there is no evidence that these losses to consumers have been offset by reductions in retail prices or improvements in the quality of retailer service. The empirical evidence thus provides no support for the view that consumers have derived any net benefits from the intervention.”
It’s fair to say that interchange is a costly fee for card-accepting merchants. But cutting it appears to impose net costs on consumers in the form of higher banking fees and lower rewards. So in a two-sided card network, interchange reduction basically amounts to a zero-sum wealth transfer from consumers to merchants. Of course, you can always argue that merchants deserve more consideration than consumers but to my knowledge no anti-interchange advocates actually make this point, presumably because it doesn’t play as well as the classic cartoon representation of a mustache-twisting cabal of banks and card networks extracting value from helpless merchants and consumers.
Consider this screechy article from The Week[123], which declares: “There is no possible moral or economic justification for these fees. Credit card companies and their bank allies are just abusing their market power to soak the rest of society for easy fat profits” and “the immense profits of Visa, Mastercard, and the card-issuing banks are sheer parasitism”.
No possible moral or economic justification? Sheer parasitism? That’s a little intense. Thanks to the card networks, merchants realize more sales volumes than they otherwise would and consumers enjoy rewards, convenience, and global acceptance. Because of continuous investments in fraud management and the collateral requirements that card networks set for member banks, you can hand your Visa or Mastercard to any one of 170mn merchants around the world, complete a transaction within seconds, and know that if you’re ripped off you will be made whole. The merchant, without knowing anything about you, can rest assured that money from your bank will reach theirs. For enabling all this, the card networks take just ~0.2% of the transaction value. That’s not a scam; it’s a marvel.
Or here’s a letter [131]addressed to members of Congress in which the Merchant Payments Coalition, a group of merchants “dedicated to fighting unfair credit and debit card fees” writes of Visa and Mastercard’s dominance of the US credit market:
This blocking of competition drives up prices for merchants and consumers, harms security and strangles innovation.
And in this edition[132] of the SITAL Week newsletter (which I enjoy and recommend subscribing to), Brad Slingerlend, who quoted from that article from The Week in apparent agreement with its premise, writes:
It’s popular to raise the golden “network effect” defense of credit cards payments. I don’t completely disagree, but the stranglehold of Visa and Mastercard in the US is causing consumers and merchants, notably small businesses, to miss out on progress and innovation, as evidenced by less than 10% consumer adoption of mobile payments[133] in the US despite their widespread use in other parts of the world.
To use the fact that Americans more often pay for things with their cards than with their phones as evidence that consumers and merchants are missing out on progress and innovation is to have a weirdly narrow definition of progress and innovation. Like you know that Visa and Mastercards are tricked out with NFC technology that allow shoppers to tap-to-pay with them in much the same way they would with smartphones? More than half of all face-to-face Visa transactions (~30% in the US, 70% everywhere else) are now contactless.
Besides, card rails aren’t even about cards anymore. Visa and Mastercard care about credentials, not physical plastic rectangles. Whether you swipe with a card or transact through a digital wallet linked to a V/MA card makes no difference to them. Americans still use cards more often than not at checkout, sure, but they do so out of habit and choice, not because grasping card networks make any other option impossible.
More generally, I find it easier to argue that card networks enable more innovation than they cripple. Much as AWS and Azure have allowed a new generation of SaaS companies to scale by eliminating the heavy upfront costs of compute infrastructure, so too have the open rails and merchant networks of Visa and Mastercard given rise to new issuers and digital wallets. The growing breadth of products from Stripe and Square are built atop payments businesses that have only scaled as a rapidly as they have thanks to the card rails. Visa powers modern card issuing platforms like Marqeta, whose APIs allow developers to customize spend preferences and manage payment programs. Even crypto exchanges like Coinbase are rendered more useful by the bridge to fiat laid out by the card networks.
As you can plainly see, I disagree with the argument that Visa and Mastercard are rapacious, innovation-stifling actors. But I understand where it’s coming from. Visa and Mastercard indeed constitute a powerful duopoly in the US. Interchange fees have an explicit and direct impact on merchant profits while the counterfactual impact on sales volumes and network security were those those fees to go away is invisible. Merchants bearing the concentrated and explicit costs of interchange are far more motivated to write letters to their Senators than consumers, who don’t even know what interchange is let alone that it funds the perks they enjoy. If your understanding of card networks is limited to news articles and click-bait editorials, you will come away with a simplistic and distorted understanding of how the payments ecosystem works, overlooking the trade-offs and compromises and flavors of coopetition that allow it to function as well as it does.
Still, perception shapes public outrage which in turn can guide regulatory interference. Sensemaking is not an antidote to misguided regulation. That the justification for CCA seems at best incomplete doesn’t preclude its passage. Durbin tried but failed to attach CCA as an Amendment to the National Defense Authorization Act this October and I don’t know where things stand today. There are various costs and complications to enforcing CCA, like re-issuing cards, re-jiggering point-of-sale software and hardware, plus what happens to a consumer’s rewards if a Visa card transaction is routed to a non-Visa network? But were it to pass into law, the Actcould be more damaging to the card duopoly than the 2011 Durbin Amendment ever was. The latter regulation crushed debit interchange but didn’t cut Visa and Mastercard out of the transaction loop, nor did it have any discernible impact on their fees, which are separate from interchange. By allowing the merchant to route transactions to lowest cost networks, the CCA competes down interchange fees but also, more consequentially for V/MA, raises the possibility that payment flows will be routed to competing networks. Visa and Mastercard will naturally argue that smaller rails with fewer resources to invest in fraud management may be less secure, but even if that’s true I suspect most merchants will assume all card networks are equally safe and just go with the cheapest option.
In a battle between small merchants and a big bank/card network partnership, public officials will always side with small merchants, especially since another protected class, consumers, are too unorganized and uninformed to understand how they are being net harmed by any resulting measures. This means the threat of regulations and fines always looms in the background for Visa and Mastercard. I won’t get into it all here. Just Google “Visa and Mastercard, antitrust” or whatever and you’ll see all sorts of articles about probes and fines that have been directed at the card networks over the years. I’m not saying these punitive measures were unjustified (they may have been, depending on trade-offs you are willing to make), just that regulation is an ongoing overhang, not some one-off. But so far the card networks have thrived in spite of the scrutiny. Visa and Mastercard are like the Teflon Dons of corporate world. Nothing really sticks.
With respect to ostensible fintech threats, the card networks are more like The Blob, getting stronger as they absorb the benefits of wallet and POS innovation. When PayPal boosts checkout conversion by introducing an in-app SDK and password-free authentication, or when Apple enables iPhones to be used as point-of-sale terminals, Visa and Mastercard are indirect beneficiaries. Visa’s merchant footprint and credential count have 4x’ed over the last decade, in large part thanks to the profusion of wallets, fintech issuers, payment facilitators, and terminal form factors32[134]. There are more direct challenges to the card rails at the infrastructure layer. But just because alternative rails exist doesn’t mean consumers will use them. Can they handle dispute resolutions and chargebacks? Do they offer 0 liability protection and dual messaging[135]? Do they have a long, proven track record of security and reliability? RTPs will get more featureful over time but as Visa President Ryan McInerney put it, “comparing an RTP transaction in 2022 to a Visa Debit transaction in 2022, let alone a credit transaction, is kind of like comparing…a landline rotary phone to an iPhone”. And while I don’t want to tempt fate, given V/MA’s global merchant acceptance and widespread consumer adoption, taking the disjointed parochial rails too seriously is a bit like wondering “is the Albanian army going to take over the world” 😉
That doesn’t mean crypto, RTPs, or BNPLs won’t capture a growing share of the incremental electronic payments. But with digital continuing to eat away at $9tn of annual cash retail transactions across the Americas and Europe, fueled by e-commerce penetration and continuing incremental advances in payments technology that alleviate friction and expand acceptance, V/MA’s carded volumes should continue to outpace PCE growth for many years to come. Moreover, the card rails are insinuating themselves into all the newfangled modes, with on and off ramps to crypto, multi-rail networks, and open BNPL enablement. Where payment flows don’t monetize directly – as in ACH and large swaths of B2B – Visa and Mastercard are instead trying to add value further up the stack.
Disclosure: At the time this report was posted, accounts managed by Compound Insight LLC owned shares of MSFT. This may have changed at any time since.
some thoughts on Adyen
Posted By
scuttleblurb
On
In
SAMPLE POSTS,[ADYEN] Adyen N.V. |
2 Comments
Before exploring the competitive concerns that have sent shares cratering nearly 60%, it’s worth reflecting on what it is that got people excited about Adyen in the first place.
In a typical online transaction, a shopper’s credit card details are picked up and encrypted by a gateway, then routed to the appropriate merchant acquirer. The merchant acquirer, through a payment processor, sends that information to Visa or Mastercard, who routes that information to the card issuing bank, who authorizes the merchant acquirer to accept payment. Merchant acquirers and payment processors are often seen as one in the same but they technically play different roles. Merchant acquirers are financial institutions. As members of card networks, they bear responsibility for chargebacks and disputes, ensure that the merchants they onboard comply with regulatory requirements and, assuming the transaction is approved, receive money from card issuing banks. Payment processors are software. They intermediate transaction details between the gateway and the acquiring bank.
The confusion between acquirers and processors is understandable as incumbent processors like First Data and Vantiv were once owned by banks before being cleaved off as separate entities, creating a daisy chain of interactions where most steps in the payments flow were handled by different entities. A gateway like CyberSource or Braintree was distinct from a merchant acquiring bank like Wells Fargo, Bank of America, or Citigroup, which in turn was separate from a merchant acquirer processor like First Data or Worldpay. The fragmented, arms-length arrangements forced merchants to maintain a host of connections. A large multinational retailer might have relationships with dozens of different merchant acquirers and gateways across the globe.
In the 2010s, payment service providers (PSPs) like Stripe emerged to simplify this process by sitting between the merchant and acquiring banks. Instead of opening accounts directly with acquiring banks, a process that could take weeks, a merchant could instead open an account with Stripe, who would rent the Bank Identification Number (BIN)33[136] of acquiring banks (”rent-a-BIN”). This arrangement gave Stripe the right to onboard merchants according to the acquiring banks’ underwriting rules, provide ongoing account services to the merchant, authorize transactions, and collect transaction data. Stripe pays a fee to the acquiring bank, who still assume risk of loss but otherwise retains most of the merchant acquirer economics.
So, to a writer with a paywalled blog on Substack it might appear that Stripe is talking directly to card networks and sending funds from the subscriber’s bank to yours. But under the hood what’s happening is Stripe is sending encrypted card details to an acquiring bank like Wells Fargo or PNC, who in turn is using First Data or some other processor to interface with card rails. Some payment providers will say they offer “merchant acquiring services” or even refer to themselves as a merchant acquirer. But usually what they mean is they are licensing a BIN from third party financial institutions. It is crucial that PSPs process volumes locally, either by owning a bank license or renting one, in each country that they accept payments, as domestic transactions are settled faster, avoid FX fees that attach to cross-country processing, and more likely to be approved by local card issuing banks, who see purchases within their borders as less risky.
The card networks we’re most familiar with in the US are but a fraction of payment methods available globally. Bank transfers are used in 1/3 of online transactions in Germany and in just over half of online transactions in the Netherlands. In India and Thailand, bank transfers and wallets account for around 60% of e-commerce purchases. Moreover, a wide variety of card schemes, bank transfer apps, wallets, and other payment methods are used in different regions and countries, including MercadoPago in South and Central America, Samsung Pay in Asia Pac, Boleto and PIX in Brazil, iDEAL in the Netherlands, Alipay in Asia, PayPal in Germany and the US, etc. Often times, PSPs will rely on aggregators to access the most widely accepted payment methods in every country. For instance, Stripe, PayPal, and Global Payments integrate with an aggregator called PPRO[137], who in turn maintains connections with more than 400 non-card payment methods across the globe.
Adyen started as a gateway but took things several steps further. Instead of renting BINs or integrating with an aggregator, they own banking licenses outright wherever they can34[138] and directly integrate with local payment methods. Combining the gateway with merchant acquiring and processing means Adyen can underwrite merchants according to their own compliance standards and save on fees they would otherwise pay a third party acquirer. But more importantly, it gives them greater visibility into and control over the payments flow. As an acquiring bank with direct access to card rails, Adyen can iteratively tweak messaging details in an authorization request to improve the chances that the issuer bank will accept it. If a payment fails due to a connection issue at the level of the acquiring bank or processor, they can more easily see and rapidly fix it than most other payment service providers, who obviously can’t inspect the systems of the acquiring banks they rent BINS from. Adyen, more so than any other PSP, is very opinionated about owning the full stack. They would rather not process payments in a country at all than gateway to third party acquirers, whose variable performance dilutes their exacting service standards.
Control not only applies to the payments flow but extends to the enabling technology. Adyen runs a single platform that it built from the ground up. A merchant need integrate just once to access processing capabilities anywhere in the world, both online and at physical point-of-sale. All merchants share the same platform. Upgrades and new products are rolled out across the globe at once. By contrast, legacy PSPs like Worldpay stitched together a patchwork of providers through a flurry of acquisitions. After struggling to build unified platforms, most legacy providers gave up and came to accept the disparate hodgepodge. First Data’s integration saga went on for about a decade before they threw finally in the towel. Now they’re stuck in this sclerotic state where updates to one platform aren’t automatically carried over to the others; new products, like risk management or FX tools, need to be built multiple times to accommodate different codebases; and transaction data that could inform risk scores and improve authorization rates circulate in siloes.
Incumbents responded to the mounting threat posed modern PSPs, not by streamlining their platforms to better compete, but by doubling down on megamergers. But buying scale never resolved the root problems that caused them to lose so much share in the first place. In a damning indictment of this acquisition-fueled strategy, FIS recently agreed to sell a 55% interest in Worldpay[139], valuing the latter at $18.5bn, a whopping 55% discount to the $43bn it paid just 4 years earlier.
But even compared to Stripe, arguably the most celebrated modern PSP of all, Adyen stands out. In 2022, Adyen reported 55% EBITDA margins on about $278mn of payment volume $483k of net revenue per employee (on today’s frontloaded employee base, which has grown by just over 50% from a year ago, Adyen is doing just $405k of net revenue per employee). By contrast, Stripe lost money on just $102mn of volume and $350k of net revenue per employee (they are supposedly on pace to hit $100mn of EBITDA this year…but including stock comp?)35[140]. Some will object that the difference in profitability is due to compensation in the US being substantially higher than it is in Europe. That explains some, but not all of it. Even if Stripe’s expenses/employee were the same as Adyen’s last year, its EBITDA margins would have still been about 20 points lower.
For years the payments landscape was bifurcated between incumbents with meager growth who managed for margins and modern fintechs who reported losses but stole volume. Adyen avoided this trade-off. While legacy players acquired growth, adding to the jumble of platforms that made it so hard for them to innovate, Adyen grew organically, scaling one global platform. While modern fintechs splurged on pricey engineering talent, Adyen accelerated its hiring only in the last 3 quarters, when it was able to pick up for cheap talent that its peers were eagerly laying off. While PayPal groped its way toward a super-app and Stripe bet on sprawling initiatives to advance the grandiose vision of expanding “the GDP of the internet”, Adyen concentrated its engineering resources only on products its merchants wanted. In a sea of sloppy execution and distraction, the company exhibited a profound degree of focus, discipline, and frugality.
These unique cultural attributes powered eye-popping growth and industry-leading margins. Management announced last year it would be accelerating headcount to support growth, particularly in North America, an investment that would temporarily depress margins. But this was well understood and even celebrated (”look how long-term they are” “they zig when others zag” “capacity to suffer!”…that kind of thing). Then last quarter, Adyen cited “increasing competitive pressure in North America” as the culprit behind a dramatic deceleration in the region (net revenue growth in North America went from growing 36% in 2h22 to just 13% in 1h23) and everyone freaked out. It is one thing to invest ahead of growth. It is quite another to invest behind a structurally impaired market.
It soon became clear that price cutting at Braintree was most salient cause of the intensifying competitive environment.
Setting aside the execution and strategic issues that have plagued it, PayPal, who I once described as a “gangly fintech behemoth running on legacy tech whose long tail of fintech assets are united by vague super app ambitions but otherwise lack concrete product and ux cohesion”, is still a ubiquitous and trusted brand among consumers, who are supposedly more likely to convert into shoppers and spend more if the PayPal button is featured at checkout. In 2013 they acquired Braintree, an “unbranded” gateway that merchants could white label to accept payments across different merchant acquirers. A sideshow inside the PayPal complex, Braintree more or less operated as a separate entity for years. It was never prioritized for investment and lagged behind Adyen and Stripe, who have in the intervening years released a slew of additional products atop their payments baseload (from 2015 to LTM, Adyen’s processing volumes have grown from €32bn to €848bn while Braintree’s have grown from $50bn to an estimated ~$450bn). But after 8 years of trying, management claims that PayPal and Braintree now run on the same modern tech stack.
The technical integration is reflected in their commercial strategy too. Branded PayPal realizes much higher margins than Braintree, even controlling for differences in merchant mix, mostly because the former doesn’t pay interchange fees, the biggest “cost of goods” for a payments facilitator, on the 20% of PayPal transactions that bypass card rails. Moreover, according to Lisa Ellis from MoffettNathanson in her interview with Stratechery[141], a disproportionate amount of the other 80% flows through debit, whose interchange fees are much lower than credit. But the PayPal brand was also musty and saturated and facing competition from a host of alternative e-wallets. So to stoke branded adoption, PayPal began loss-leading with Braintree, giving the latter away at ~cost to merchants who also featured the PayPal checkout button. This maneuver has had a predictable effect on Braintree volumes, which swelled ~30% YTD to ~$450bn after growing 42% in 2022 (by comparison, in 2022 Adyen’s volumes grew 49% last year to $829bn while Stripe’s volumes grew 26% to $817bn).
Loss-leading with Braintree to boost branded PayPal adoption poses a conflict since PayPal is incentivized to push its own wallet while Braintree is compelled to integrate with all the most widely used payment methods. Braintree can choose to be agnostic about payment methods, but pricing at cost means that volumes processed through credit cards, Apple Pay, or any other medium except PayPal, are destructive to unit economics. Alternatively, Braintree can prioritize PayPal at checkout but doing so renders them less competitive with PSPs who feature a wider range of options.
Whether cross-subsidization proves viable ultimately boils down to how much shoppers prefer PayPal over other competing payment options. The incremental gains from using rock-bottom take rates at Braintree – take rates that don’t make sense absent a lift in branded PayPal volumes – to get the PayPal button prominently tattooed on more checkout pages could be more than offset by the incremental losses generated from transaction volumes shifting to Apple Pay or Shop Pay as online commerce continues to migrate to smartphones. It doesn’t matter if the PayPal button is featured in more places than it already is if people use it less. Even if branded volumes grow in aggregate, a big enough mix shift toward competing payment options intermediated through Braintree across the entire merchant base would still adversely impact profitability. So really what this strategy amounts to is doubling down on the PayPal wallet and, along with that, a bet on the associated investments and initiatives that the company has for years pursued to maintain branded PayPal’s relevance in eyes of consumers. Same as it ever was.
Will shareholders stick around for more of that? They’ve seen the stock crater by nearly 80% from its peak just more than 2 years ago. Transaction profits have declined from 1.3% to 0.89% of volumes since 2020 as margin dilutive unbranded volumes, fueled by aggressive pricing, have outpaced branded. Meanwhile, the company’s outsized stock based comp and flat margins seem out of sync with renewed concerns over profitability.
Braintree is rumored to have started cutting price ~1.5-2 years ago, which coincides with the marked deterioration in transaction margins and acceleration of Braintree volumes. That enterprises have become particularly cost-conscious and receptive to easy wins in the last few quarters could be why Adyen didn’t see much of an impact until this year. PayPal insists that unbranded margins will improve as Braintree caters to more smaller merchants (net revenue spreads are higher for low-volume customers), expands internationally (interchange costs are lower in Europe than in the US), and cross-sells ancillary FX and risk management services. In fact, they expect transaction margin dollars, which contracted in 2022 and ytd, to grow again in 4q. But that’s going to hard to pull off if they keep taking Braintree pricing down in the US, which still accounts for the vast majority of their volumes. So it’s possible that as low as Braintree pricing is today, it won’t be driven even lower from here, in which case the migration of processing volumes to Braintree should start to slow.
Still, you don’t necessarily want to bank on that? Even setting aside vigorous price cutting by Braintree, North America is an insanely competitive market and has been for decades. It is unrealistic to think that Adyen can deliver consistently better authorization rates here. Even with local acquiring and a modern tech stack, they are likely at a structural disadvantage to JP Morgan Chase, who issues about 20% of credit cards in the US and a similar share[142] of merchant acquiring. If Adyen claims data advantages by owning the gateway and acquiring bank, how much better off still is JP Morgan, who owns the gateway, acquiring bank, and the card issuing bank, for the significant minority of US transactions intermediated through its cards? I would think that Braintree routing a Chase BIN to Chase produces systematically better auth rates than Ayden processing a Chase BIN internally? And then of course, Chase can and does loss lead with payments processing to win profitable banking and treasury management business.
But parsing performance by geography alone without considering broader strategic context is missing the forest for the trees. Adyen was carried to North America by its multinational merchant base and developing a presence there lent weight to its founding premise of offering local payments anywhere in the world on one platform. They have an opportunity to, in a sense, do some loss-leading of their own, only across geographies instead of payment layers, tweaking pricing in North America in service of a broader relationship that encompasses all the other regions, where payments is less commoditized and more fragmented.
The unique value that a PSP offers varies by use case and region: digital-only payments is a commodity in North America and somewhat less so in heterogeneous region like Europe, where payment types and compliance requirements vary by country. Marketplaces and platforms like eBay, Shopify, and Airbnb have complex global acquiring needs, but they are also tech companies at heart who have the resources and know-how to handle risk and KYC functions in-house, as well as the scale to negotiate favorable rates. Adyen is going after SMBs by plugging into the platforms that increasingly host them, thus converting SMB acquisition into a familiar enterprise sales motion. Its marketplace/platform product, Adyen for Platforms, has seen volumes explode from €3bn in 2019 to €102bn LTM, in large part due to eBay, a customer that Adyen stole from PayPal. Net revenue has got to be razor thin as a fraction of volumes but also very incrementally profitable on Adyen’s largely fixed cost base…plus, payments creates an opening to cross-sell lending, issuing, and other high margin ancillaries to the platform’s merchant base.
Where Adyen stands apart from the pack is in its ability to serve sophisticated global retailers who are not tech companies themselves but are tech-forward enough to embrace omnichannel. It is far easier for large merchants to do BOPIS, online sales with offline returns, and otherwise create 360 customer profiles by consolidating on a single platform that traverses both digital and physical commerce. Volumes from Unified Commerce (omnichannel) have exploded from just €45bn in 2019 (19% of total processed volumes) to €225bn (27%), with the point-of-sale component ballooning from €17bn to €124bn. Over the last year, UC and POS volumes have grown 47% and 54%, respectively, outpacing the 30% growth rates posted by Digital-only, where the competitive pressures from North America have been most acutely felt. Besides the deluge of payment volumes it delivers, omnichannel is a hook for more enduring and expansive engagements. Offline commerce is stickier – it is much harder to swap out physical terminals than it is to direct online volumes to a competing PSP – so a retailer who uses Adyen for point-of-sale and takes omnichannel seriously will also be more inclined to route online volumes to Adyen as well, assuming no systemic deficiencies in authorization rates. As customers consolidate more of their flows, Adyen can monetize other hooks like risk management, card issuing, capital, and payouts.
So if North America is a race to zero, then that raises the question of who is providing the most value elsewhere. Everyone will do FX services, risk alerting, issuing, and the rest. But Adyen seems uniquely placed to claim end-to-end local acquiring across many regions at once, online and offline. To put it another way, Adyen is more an “N of 1” in the thing they are known for than other PSPs are in the things they are known for. They are also more unique and moated relative to other PSPs than PayPal is to other wallets. Braintree is predominantly focused on the US and doesn’t have full control of the merchant-side payments stack. Mollie is geared to SMBs in Europe. Stripe got started with developers and SMBs and has been trying to climb upmarket, but isn’t yet on par with Adyen in addressing global enterprise use cases and lags behind Adyen in omnichannel. Checkout.com[143] is a European rival that also targets large enterprises with a modern tech stack and local acquiring licenses. While often overlooked in payments conversations – I think most investors would be surprised to know that Checkout was valued at $40bn at its Jan. 2022 peak before it crashed with everything else in fintech – they actually seem like a promising contender to Adyen, at least when it comes to digital-only flows. Meanwhile, I can think of more reasons why Apple Pay and Buy with Prime are better positioned to take share from PayPal than vice versa.
In a nutshell, Adyen’s advantage exists at the intersection of several capabilities. All payments are local but the large enterprises and platforms that Adyen serves are global. There are lots of PSPs out there that can do local processing, but they don’t have Adyen’s global scale. There are incumbents with global scale, but they don’t run a unified platform through a single integration. Payment processing in North America may be a commodity, but local acquiring scaled globally is not. If Braintree insists on pricing at cost, then Adyen will have no choice but to get off its horse and take prices down too. But in my opinion they are better placed to sustainably do so than PayPal both because their cost structure is leaner and because local acquiring at global scale through one platform is a far more differentiated prop that earns them the right to take profits elsewhere.
That Braintree price cutting has had such a sudden and material impact on Adyen volumes in North America has also revived concerns that payments provision is being further commoditized by orchestration layers that make it easy to route transactions to different PSPs based on authorization rates and cost. Disintermediation and aggregation have been ongoing themes since the dawn of electronic payments. Card networks like Visa and Mastercard replace sequestered credit lines at each merchant with one facility that works across all of them. E-wallets like PayPal encompass ACH, account balances, or credit cards. PSPs like Stripe or Adyen subsume wallets, credit card, and bank transfers, payment methods that in turn can be intermediated by an aggregator like PPRO in foreign markets. Gateways provide choice across different acquirers, orchestration platforms do the same across different gateways and PSPs.
The pitch from orchestrators is that responsible merchants should avoid locking themselves in to any one PSP or gateway. The subtext, of course, is that in doing so, the merchant should be more dependent on them. I’m skeptical that PSP orchestration is solving a hard enough problem to warrant a seat at an already crowded table. The sophisticated retailers and platforms that Adyen serves, the type of customers that most value orchestration, already process through dozens of PSPs and will have built routing logic in-house. They might engage a primary acquirer to handle like 60% of flows in a certain region while spreading the remainder across several others, dynamically re-directing volumes if authorization rates or processing costs trip certain thresholds, routing flows based on a PSP’s track record of handling various transaction types.
None of this new. Orchestrators have been around for decades. Enterprise merchants have always plugged into multiple PSPs. And yet, with 80% of payment volumes coming from existing customers and less than 1% of volume churning every year, a significant chunk of Adyen’s growth has come from consistently taking wallet share36[144]. Those share gains have coincided with Adyen acquiring banking licenses and offering omnichannel capabilities in new territories, as what might begin as a limited online-only engagement with a retailer in one country eventually expands into an omnichannel relationship across several. Much as Google has retained search share despite competition being just “a click away”, Adyen has consumed a greater share of volumes from merchants who could rather easily re-route to any number of PSPs they connect to, validating the package of competitive auth rates and ease of integration and settlement reporting that Adyen differentiates on.
Given that enterprise customers continue to engage with myriad PSPs, I suspect there is more wallet space for Adyen to carry its advantages into than there are existing volumes for orchestrators and alternative PSPs to route away, particularly since the value of a single integration that handles and formats settlement data in a uniform manner across channels and countries grows as more volumes are concentrated on it. That doesn’t mean a global merchant will sole-source on Adyen (this will never happen). But I can entertain a scenario where an enterprise merchant or platform defaults to the PSP that can solve the hard problem while a jump ball on the commoditized parts, like North American digital-only commerce. In which case, we could see orchestrators starved of oxygen as Adyen, who I’m pretty sure doesn’t plug into third party orchestrators, continues to take wallet share.
I bought some shares of Adyen last month. It’s a small position. That I even own it at all basically reflects my view that Adyen has a uniquely strong value prop for a large slice of global commerce and is run by a thoughtful founder with skin in the game37[145] who will figure out how to convert that position into shareholder value. Payment processing isn’t a franchise like Moody’s. It’s a fast-moving, competitive space that a lean and agile organization like Adyen will maneuver through better than its heavier competitors.
That I haven’t sized it bigger reflects my uncertainty about where profitability ultimately settles and how large the addressable market is for the particular set of capabilities Adyen brings to bear. Management stands behind its long-term 65% EBITDA margin guidance and says it could get there “very, very quickly” if it weren’t investing to support growth. Whether that’s true depends of course on the competitive posture in North America, how Adyen responds to it, and to what degree take rate compression spills over into Europe. Maybe Adyen remains firm on price, PayPal reverses Braintree loss-leading to right its transaction margins, and North American pricing normalizes? Maybe Adyen relents on price and parlays US volume wins into more encompassing global engagements, such that lower transaction margins are offset by volumes to produce similar amount of profits? Moreover, the part of the global payments TAM that Adyen can attack at durably compelling margins is constrained by the fact that its right to earn is grounded in the unique way it serves global merchants with multifaceted flows who think of payments as something more than a commodity. Like, it would be wrong to compare Adyen’s $145bn of point-of-sale volumes against tens of trillions of global offline volumes since only an unknown subset of the latter lands in Adyen’s sweet spot.
All that said, I don’t think you need 65% margins and heroic growth rates for the stock to work from here. Over the next 5 years, if we assume growth is 0 in North America (vs. 33% y/y growth LTM), 15% in EMEA (20%), 20% in Latam (24%), and 25% in APAC (37%), I blend to about 14% on a consolidated basis (compared to 25% LTM and 33% in 2022). This gets us to about $2tn of processed volumes, about where Chase, Worldpay, and First Data are today. Assuming 70% of incremental revenue drops to EBITDA, I land at 58% margins (vs. 63% in 2021). With 80% of EBITDA dropping to net earnings, I can pencil 12%-13% returns at a 25x terminal multiple, including accumulated free cash. Now, even after losing 60% of its value, Adyen still trades at 36x (hopefully depressed) trailing earnings – a huge premium to legacy peers, who trade at low-teens, and in the same ballpark as consensus compounders Visa and Mastercard – so it’s not like the market thinks the company is another payments shitco. I don’t think Adyen is a screaming bargain here. But it’s interesting enough (for me) to get started.
Disclosure: At the time this report was posted, accounts managed by Compound Insight LLC owned shares of Adyen and Moody’s. This may have changed at any time since.
[VRSK – Verisk] High Quality Cash Flow, Limited Reinvestment Opportunities
Posted By
scuttleblurb
On
In
SAMPLE POSTS,[VRSK] Verisk Analytics |
No Comments
When evaluating the competitive advantage of a data-based analytics business, three important questions come to mind: 1) Is the data proprietary? 2) Are the insights from the data critical? and 3) Does the data fuel a product feedback loop? Verisk began its operations in 1971 as Insurance Services Offices (ISO), a non-profit enterprise started by P&C insurers to collect industry data and information that was used by its sponsors to determine premium rates, underwrite risk, develop products, and report to regulators, basically acting as a cost center for the P&C industry. The entity expanded into analytics with its acquisitions of American Insurance Services in 1997 and the National Insurance Crime Bureau in 1998 (which brought expertise in claims fraud detection and prevention) before converting to a for-profit organization in 1999 and going public in 2009 as Verisk (ISO became wholly-owned subsidiary of Verisk). The company acquired a bunch of companies from its ISO days to today, bolstering its core insurance risk assessment services and expanding into new industry verticals. Verisk’s decades-long legacy as the central repository of P&C industry data is the heart and soul of its competitive advantage and has served as the foundation on which all its other offerings have been built over the years.
It is difficult to overstate the critical role that Verisk plays in pricing, claims management, and administrative efficiency across the P&C industry. For instance, Verisk sets the de facto industry standard on language – “court-tested” and found in 200mn of the 250mn policies issued in the US – used in policy forms sold to insurers via subscription that ensures consumers are getting the same amount of coverage for the same quote across insurers. The company sits at the center of a network that procures data from a wide variety of sources (claims settlements, remote imagery, auto OEMs), analyzes it, and delivers predictive insights to clients (insurers, advertisers, property managers). The agreements through which a customer licenses VRSK’s data also allows the company to make use of that customer’s data….so essentially the customer pays Verisk for a solution that costs almost nothing for the company to deliver and Verisk gets to use that customer’s data to enhance its own solutions, which improved solutions reduce churn and attract even more customers (and their data) in a subsidized feedback loop.
This flywheel, built on top of Verisk’s historical advantage as the repository of industry data, has generated world’s largest claims database (VRSK aggregates claims data from 95% of the P&C industry), containing granular information on 1.1bn claims (up from 700mn claims in 2011), with the insurance ecosystem submitting ~200k new claims a day across all P&C coverage lines. It would be effectively impossible for a competitor to replicate this ever-burgeoning flurry of data. [Aside: VRSK’s spending on public clouds has dramatically escalated over the last few years, allowing the company to not only realize considerable cost savings (without public clouds, it would have been far more costly for Verisk to secure engagements with European retail banks, who operate under strict privacy laws that require data to reside within the country of origin) and flexibility as its datasets continue to expand in girth and complexity, but to also apply machine learning to those datasets and enable new functionality to its services].
Comprehensive data paired with a decent model generates better insights than limited data paired with a great model. An insurer that relies solely on in-house claims experience cannot underwrite risks with nearly the same degree of accuracy as one with access to the entire industry’s data. Consider all the vehicle ratings variables – make & model, location where the car is garaged (down to one of 220k census blocks), mileage, driver’s record, semi-autonomous / safety features in the vehicle – that VRSK accounts for in assessing loss costs on 323 ISO series cars (cars that are part of the ISO ratings series used to match premiums to type of car). Or the construction costs – from roofing material to drywall to electrical and HVAC contractor rates – monitored across 460 regions across North America and updated monthly using Verisk’s Xactware software, which insurers use to quantify replacement costs, including labor and material costs, within 21k unit-cost line items in the event of a claim and compare computed insurance-to-value estimates to those submitted by brokers at the beginning of the underwriting process. A contractor who shows up to a damaged home after a storm can leverage the 100mn price points stored in Verisk’s database, estimate a policy claim, and then share that information with the policyholder, adjuster, and the claims department.
Like Verisk’s policy forms, Xactware, too, is an industry standard used to estimate nearly 90% of all personal property claims in the US. Data is further leveraged to improve efficiency and the front-end experience of insureds. For instance, per one case study, a large auto insurer typically spent 15 minutes walking a policy seeker through its sales funnel (an initial 40-question quote inquiry that transitioned to processing, where 35% of qualified leads had their initial quotes changed, and finally to binding), with lead leakage at each step along the way, ultimately translating into a conversion rate of just ~7%. With Verisk’s LightSpeed, the insurer spent less than a minute on the sales process and doubled its conversions. By sifting through a deluge of 300mn transactions per month pulled from odometer readings, vehicle reports, and claims loss history, Verisk only needs a few pieces of information from the customer upfront to arrive at the right price within seconds at the point of quote. With claims settlements absorbing 2/3 of the $600bn of premiums collected by the US P&C industry every year (not to mention the $6bn-$8bn of fraudulent auto injury claims), and the industry as a whole generating negligible underwriting margins over time, solutions that improve operating efficiency, improve sales outcomes, and accurately estimate the industry’s largest expense item, are obviously critical.
Verisk’s products are tightly integrated into customers’ workflows and consumed as subscriptions (subscriptions represent ~85% of the company’s revenue).
1) Is the transformed data proprietary? Check
2) Are the insights from the data critical? Check
3) Does the data fuel a feedback loop that deepens the data moat? Check.
VRSK has a nice moat in the P&C vertical. But of course the best companies not only have dominant competitive advantages around their existing business, but also huge advantaged growth opportunities, and it is here, I’m afraid, that prospects look bleaker. Here are what management sees as its growth opportunities: Cross-selling: Selling existing products to new customers and introducing new products to existing ones. This is the most compelling opportunity from a probability-of-success standpoint and has motivated much of the recurring tuck-in acquisitions made by the company over the years. Over the last several years, the company has re-oriented how it approaches the customer, moving away from a siloe’d approach to product sales to integrated teams: most of the company’s sales to insurers are bundled products that improve customer stickiness while boosting revenue and sales personnel are compensated on product sales made across both reporting segments (Decision Analytics and Risk Assessment).
New verticals:
Repurposing existing IP and capabilities to breach new industry verticals seems reasonable in theory, but has had only so-so results in practice. For instance, in 2004 the company acquired its way into healthcare (reporting systems and analytical tools for health insurers) where it could bring its expertise to bear in a big market beleaguered by hundreds of billions of dollars of annual fraudulent claims. The company also thought that understanding the healthcare market would give it greater insight into workers comp, which constitutes 20% of the P&C market and where rising medical costs constituted a growing portion of claims. Management pushed further into the space with significant healthcare acquisitions in each of 2010, 2011, and 2012, with seemingly robust growth for several years before healthcare revenue suddenly contracted in 2015. Then, in a sudden about-face, the company put Verisk Health up for sale in late 2015, blaming a regulatory and industry structure that made it hard to acquire unique data assets. Another example. In 2005, Verisk acquired its way into the mortgage sector under the premise that personal property data collected in the P&C business could be leveraged to detect fraud in the mortgage lifecycle only to divest this business in March 2014.
Based on my experience, companies that acquire a bunch of companies only to divest them years later usually leave huge craters in shareholder value. That is not the case here. Verisk Health, sold for $820mn to Veritas Capital, realized a 12% pre-tax IRR during the company’s 12-year ownership period while the $155mn sale of Interthinx to First American implied a 15%+ annual return. While both businesses failed to hit the company’s 20% hurdle rate, they at least met a reasonable cost of capital threshold and if you were feeling charitable, you might even credit management for explicitly considering return requirements at all. The takeaway from these stories would seem to be that the company optimizes returns on capital when it reinvests in its core P&C business….which is why Verisk’s $2.8bn cash/stock acquisition in May 2015 of Wood Mackenzie, a subscription-based provider of data analytics and commercial intelligence for the hydrocarbons industry (with 99% customer retention growing ~10% organically at the time of acquisition) was a head-scratcher to me. Wood Mac is a mission critical application for anyone involved in the oil and gas industry (E&P companies, investors, banks) who needs to stay on top of the supply curve and understand the productivity of various oil projects around the globe.
According to management, there were some immediate cross-sell gets between WoodMac and Verisk Maplecroft (country risk monitoring), but the latter was a really tiny business. Apparently, the bigger, medium-term opportunity is introducing WoodMac’s data assets in the energy sector to its P&C insurance customer base, but for the time being this looks more like a standalone data business with an independent growth vector and over the last year, management has acquired several more hydrocarbon data companies to bolt onto WoodMac. After 2 quarters of growth following the acquisition, WoodMac has experienced y/y declines in each of the last 5 quarters on end market weakness and currency headwinds. So, on the surface, it looks like the company paid an 18x multiple on peak EBITDA (vs. the 9x that it has historically paid for acquisitions) for a good business, but one with questionable synergies. And then there’s this third vertical, Financial Services, within the Data Analytics segment that provides competitive benchmarking, analytics, and measurement of multi-channel marketing campaigns for financial institutions around the world, including 28 of the top 30 credit card issuers in North America. With its consortium-fed depersonalized data sets (which management claims is the most comprehensive in the payments space with a view into millions of merchants, billions of accounts, and trillions of transactions – including PoS and online transactions – tracked daily), the company offers “enhanced marketing” and risk management solutions to clients.
While the acquisitions of Verisk Health, WoodMac, and to a lesser degree Financial Services do indeed bring proprietary datasets into the company’s fold, they more mundanely resolve the problem that all great but maturing business run into, which is what to do with all the cash flow given limited reinvestment opportunities in the core business. To be clear, these acquired verticals seem like “moaty” businesses in their own right, but synergies with the core P&C vertical are murky or non-existent, so it’s unclear to me why these businesses have much more value inside Verisk than as standalone companies….and they certainly weren’t acquired at distressed, opportunistic prices.
Also, given all the big talk around ROIC metrics and the company’s recurring acquisition activity, it’s a bit irksome that management’s comp is tied to pedestrian measures like total revenue growth (at least it’s organic growth) and EBITDA margins. Anyhow, I’ve spent too much time on this topic as the core Insurance business still constitutes 70% of revenue and even more of total profits and in any case, if history is any guide, management will dispassionately evaluate these segments against target IRRs. According to management, from 2002 to 2015, the company has earned a 19% annualized return on its acquisitions (assuming a 10x exit EBITDA multiple) and a 15% return on share repurchases.
International expansion: The problem with unique data sets is that they’re, well, unique. P&C insurance is a regional market with asset types, regulatory regimes, and demographics that vary widely by country and so the robust dataset that Verisk has spent decades building in the US has little relevance overseas. As even management will admit, the international opportunity is more aptly characterized as “multi-domestic.” Furthermore, for the most part, insurance companies overseas have less sophisticated workflows compared to US insurers, and so the product bundles are slimmer and require a more consultative sales approach (i.e. they cost more to sell). The quality of the business is adequately represented by VRSK’s profitability: 50% EBITDA margins that, depending on acquisition activity, go up a little or down a little each year, but have certainly expanded over time (from 44% in 2011 and 48% in 2012).
The 70% of revenue coming from the P&C industry should basically reflect economic growth (+lsd), share gain, and cross-selling (+lsd) offset by modest contraction from customer consolidation, so call it +5%-6%. Financial services and energy, the other 30% of revenue, grows at maybe 10%-15%, blending out to something like 8%-10% growth on a consolidated basis, which maybe translates into low double-digit growth after baking in buybacks. At 27x trailing earnings, valuation seems uninspiring relative to other high quality businesses that trade at similar valuations but have far bigger growth opportunities to boot (MA and V come to mind). There are weighty long-term risks to consider as well. For instance, mass Level 5 adoption will not only reduce the number of vehicles on the road and accidents but re-define value capture within the auto ecosystem. That’s still probably at least a decade out, but on the way, improving advanced driver assistance systems that dramatically reduce accident rates (this reduction will happen quicker than some may think because of the salutary knock-on effects that equipping one vehicle with ADAS has on others. I think we’re in this moment now where the rate distracted driving has exceeded the rate at which these systems have improved, leading to a recent uptick in vehicle accidents, but the trend will resume is southerly course in due time) may reset accident curves and impugn the relevance of historical datasets, carving horizontal inroads for competitors with more generic big data and machine learning capabilities who can create new, more relevant datasets from sensor data.
[BRO – Brown & Brown] Compounder in a Fragmented Sector
Posted By
scuttleblurb
On
In
SAMPLE POSTS,[BRO] Brown & Brown |
Comments Disabled
“He wasn’t just saving his own soul when he donned his coat and hat after dinner and went out again to resume his work – no, it was also to save some poor son of a bitch on the brink of letting his insurance policy lapse, and thus endangering his family’s security ‘in the event of a rainy day.'” – Alexander Portnoy (in Philip Roth’s Portnoy’s Complaint)
Summary
Investing in a commercial insurance broker today is like being grounded on a summer weekend – you’re totally missing out on the spin-off/drop-down/Silicon Valley pool party. If Brown & Brown (NYSE:BRO) were there, it’d be the pallid in ochre tweed dawdling on the fringes, friendly but forgettable. But it’s got these fangs, man, you don’t even know.
Brown & Brown is a responsible consolidator in a fragmented sector with long-term compounding attributes and a strong balance sheet. Its dependable cash flow is stewarded by an opportunistic management team and Board which own 18% of outstanding shares. A value-heaping drudge free of catalysts, Brown offers a post-tax cash earnings[1] yield of 7% growing by an expected 9-10% annually[2] with low downside risk – generous, given the durability of its competitive advantages and the compensation offered by current riskless alternatives.
The Street’s myopic coverage is riveted to the following immediate challenges whose repercussions on long-term value, if considered at all, are embellished: 1) persistent coastal property insurance rate declines, 2) heightened private broker valuations that limit accretive capital deployment and 3) weakness in small group benefits. But housed in a moated cultural architecture – one that has conservatively and steadily created value over generations – are rejiggered incentives promoting organic growth and meaningful recent capital allocation initiatives that signal management’s belated effort to use its under-employed balance sheet.
Insurance Brokerage Industry Overview
A commercial insurance broker is an intermediary that matches fragmented buyers and sellers of property/casualty/health insurance – it works on behalf of businesses to find optimal coverage at favorable prices while acting as a distribution channel for insurers who ultimately carry the policies on their balance sheets.
The broker collects premium payments from customers, extracts a ~10-15% commission for itself and remits the remainder to one or more underwriters.
US commercial insurance brokerage is highly fragmented outside the top 10. The 100 largest brokers generated an estimated $32bn in US revenue in 2014, and of that, the top 10 accounted for 72%[3]; three global risk managers – Aon, Willis, and Marsh (NYSE:MMC) (pro forma for Towers Watson) – represented 43%. Below the top 100 are an estimated 35k+ sub-scale agencies and brokerages[4]… quaint, often family-run operations generating <$3mn in revenue.[5] Of that, I estimate there are around 15k independent commercial agencies generating about $15bn in non-personal lines commissions, of which ~5k agencies aggregating $10-11bn of commercial revenue fall within Brown’s acquisition purview.[6]
The average age of a small agency proprietor is late-50s and 18% of agencies have 20% owner/principals older than 65 years, up from 10% in 2012.[7] My college-aged cousin tells me mid-market insurance brokerage is no longer a cool career choice, so succession issues may increase the supply of motivated sellers in the coming years. Between $300mn+ in annual post-dividend discretionary cash flow and another $500-600mn from additional leverage – together nearly 20% of market cap – BRO has significant excess capital to deploy in a vast, fragmented landscape (more on this later).
While the Company occasionally trespasses into AON/Willis/Marsh territory, Brown mostly competes with the unwashed thousands for commercial middle-market customers, broadly defined as businesses paying $25k to $3mn in annual premiums (around $2.5k to $300k in commissions to Brown). Brown’s average annual commission per account is approximately $12,500, well beneath the ~$100k minimum interest threshold of the big three. Instances where Brown does service a Fortune 1000 account are typically relegated to niche pockets ignored by larger peers.
Company Overview And Competitive Positioning
As a capital-light/labor-intensive business, BRO pays around half its revenue in salaries and commissions to employees who manage customer relationships and secure new business. The Company is well diversified across industries and does not meaningfully rely on a single client or carrier. Renewal rates remain at their historically stable low-to-mid 90%, yielding a reliable source of recurring cash flow. Effectively all of Brown’s revenue is dollar-denominated and comes from U.S. customers. Over the past dozen years, about 2/3 of EBITDA[8] and 1/4 of revenue has trickled down to free cash flow to the firm, reflecting persistently higher-than-peer profitability.
One reason for this is Brown’s market focus. Sandwiched between fee-heavy national accounts and pure-commission small commercial ones, lies the commission-heavy middle market, Brown’s domain. As average account sizes grow, so do their bespoke risk attributes, and the brokers who service them assume increasingly lower margin but higher dollar-profit fee-based consultative roles.
The big three brokers have acquired major consulting businesses over the years and now derive at least half their revenue from fees. Fee arrangements make less sense for smaller accounts; as the owner of one mid-sized benefits broker explained to me, the opportunity cost of the 40 hours he might typically spend winning a new $40k commission account is the $5k from a $125/hr consulting engagement and indeed, across publicly-traded insurance intermediaries, the average EBIT margins in commission-based brokerage segments significantly exceed those of fee-oriented consulting ones (21% vs. 15%).
The second explanatory factor is squishier but more important: here’s a heartwarming yarn from the current executive chairman/former CEO – in which he reminisces client visits he’d make with his father[9] – that aptly frames Brown’s relentless sales culture.
“I remember thinking as a kid that a lot of time these were two-hour conversations; and of the two-hour conversation, the first hour and 45 minutes would be about hunting, fishing, politics, the family, the children, and the last 15 minutes would be about insurance and then we left. I thought to myself, ‘I could be a lot more efficient by cutting out most of that other stuff and just talk about insurance.'”[10]
Brown’s stalking cheetah mascot emblematizes the lean and aggressive sales ethos of an organization that rewards performing producers with generous stock grants, and where even senior executives are expected to sell. No joke, here is a line from the 2004 annual report: “Before being assured of a meal, the cheetah must finish the kill: powerful jaws clamp solidly around the throat of its prey, a tenacious grip it must hold for several minutes until the struggle ends.” As for the goosebump-inducing “money-making business” mantra that underscores sheeny photos of smugly confident, arched-back/cross-armed producers in old annual reports…yeesh.
The product of hundreds of acquisitions made throughout its corporate history, Brown’s operating model is decentralized with minimal corporate overhead, in which 190 profit centers operate autonomously and adjust deftly to local market conditions without the interference of centralized, bureaucratic mandates.
Profit centers are responsible for their own P/Ls, their financial results pitted against those of others monthly; bonuses are dispensed/dispensed with according to profitability improvements/attrition. The Company is assiduously cost-conscious and fixates on meeting budget targets, with one senior producer at Brown grudgingly touting its “bare-bones” constitution.
Heavy ownership incents organizational buy-in to cash flow maximization; in addition to the 18% of the Company owned by management and the Board, an estimated 70% of rank-and-file employees collectively own[11] ~10%+ of shares outstanding, and nearly 8% of employee retirement plan assets are parked in Brown’s stock.[12]
The cringe-worthy, carnally aggressive jingles; the indoctrinating pedagogy of Brown & Brown University;[13] management’s adamant conceit of diligently prioritizing personality types over expertise; a generous program that allows employees to purchase equity at a 15% discount to market (vs. 5% at Gallagher) and rewards “winners” with stock – all merge to a weird and competitive but cohesive compound that has yielded peer-trouncing productivity.
Moat Sustainability
Brown’s local market density, replicated across a national footprint, affords competitive advantages that are difficult to replicate. Scale intermediaries add value to the insurance ecosystem by enhancing liquidity in risk transfer markets, lubricating frictions arising from information asymmetries.
A broker with reach can: 1) scan pricing and risk appetite across its carrier relationship, reducing search costs for mid-sized businesses looking to place complex risks and 2) aggregate risks across industries, lines and/or exposure layers[14] to negotiate favorable pricing and terms with carriers that a single enterprise, on its own, cannot.
For carriers with limited visibility into a highly fragmented SME market, the opportunity cost of scaling direct marketing or captive agencies is prohibitive; it’s more efficient to interface with independent brokers/agents who have embedded client rosters in local markets. Most insurers rely on a small proportion of brokers for the majority of their premiums and are loath to compromise these critical relationships by adopting disintermediating alternatives.[15] A two-way feedback loop – propelled by clients seeking brokers with carrier access and carriers favoring brokers with heavy client flow – informs the benefits of scale that make it difficult for smaller agencies to effectively compete at comparable economics.
The big three brokers have woven their corporate identities around large accounts. Targeting nearly 600k U.S. middle-market businesses[16] requires local market knowledge that comes with widely distributed, nook-and-cranny coverage. Even if the global brokers wanted to aggressively pursue small and mid-sized books, the industry’s 90%+ retention rates suggest that organically dislodging incumbent relationships would be difficult. Furthermore, the $10bn roll-up opportunity is dispersed among tens of thousands of <$1mn revenue brokers, placing centralized entities that monarchically deploy capital from Manhattan, at a disadvantage to regionally organized scale players who have cultivated long-standing, personal relationships with local businesses and even competing agencies, and are better positioned to assess fold-in opportunities.
Perhaps more relevant than intra-industry threats are challenges lurking from without.
Disintermediation concerns from online platforms have plagued the brokerage industry since Gore funded ARPANET. Technology continues to snuff out the primordial inefficiencies of human agency in all sorts of industries, draining moats that have traditionally relied on high search costs (Travelocity/Expedia -> travel agencies) or complexity (Turbotax/LegalZoom/Betterment -> income tax preparation/legal filing/personal wealth management)…and certain insurance lines, those with easily stratifiable and granular risk profiles, are no different.[17]
Commercial insurance for mid-sized businesses, however, is different. Brown is more than a dumb distribution pipe for insurance carriers; its typical client has heterogeneous risk management needs and confronts unique and opaque price to coverage sensitivities. Unlike standardized personal lines documentation, many commercial policy forms differ significantly by carrier, bespoke “manuscript” policies are often drafted and policy language can be unregulated.[18] Given larger exposures, business insurance policies are chunkier for a carrier than, say, personal auto and pricing is tailored to reflect not only the insureds unique circumstance, but also a given carrier’s appetite for certain risk pools. According to a 2013 Boston Consulting Group survey,[19] the majority of polled SMEs in the US indicated that they were unwilling to purchase commercial insurance without the assistance of a broker mostly because of policy complexity. Personal lines pricing, on the other hand, is standardized and regulated, with state insurance regulators heavily scrutinizing consumer rate filings (people vote, businesses don’t).
Finally, with the cover-your-ass gravitas that accompanies responsibility for a dozens/hundreds of livelihoods,[20] established businesses tend to be less price sensitive than consumers when it comes to purchasing insurance,[21] prioritizing tailored coverage, post-sale service and claims coordination. One commercial broker explained to me that while a two-person start-up might behave like an indigent teenager, penny-pinching on insurance they’re brazenly sure they won’t need, employers at certain thresholds of commercial viability strongly prefer flesh-and-blood guidance.
Although commercial insurance as a whole is big business, its constituent parts are mostly niche. The companies behind heavily advertised brands address huge consumer markets where ad dollars scale, like private passenger auto. Try going a day without having Progressive’s Flo or GEICO’s Gecko quirkily nudging you to solicit a quote.[22] The deluge of price-focused marketing in personal auto has bolstered carrier brands and shifted premium market share to the direct channel. In aggregate, commercial exposures generate roughly the same amount of premiums as personal ones, but are split among more than two dozen lines compared to just two – homeowners and auto – on the personal side. At $189bn, private passenger auto is nearly 3.5x the size of the largest commercial coverage type. Although ~7% of Brown’s revenue (my estimate) is technically labeled “personal lines,” the target insured isn’t an asset-poor schlub like me nickel-and-diming his way to coverage on a used diamante, but rather a high net-worth monocled individual seeking life insurance for his prized horses, and whose coverage needs resemble those of a small enterprise.
My point is that large insurance markets populated with bite-sized risks are more susceptible to channel shifts; the further southwest risk exposures are on the market size and granularity plane, the harder or less profitable they are to disintermediate.
Small group benefits has recently been semi-legislated into one of those law-of-large-numbers markets and this 5.5% revenue pocket for BRO has experienced organic revenue declines as small business clients have offloaded employees onto public health exchanges.[23] Democratized health insurance has ensured greater covered lives volume for carriers and correspondingly, bigger commission pools for placing brokers. Guaranteed enrollment means that a broker need not expend resources culling through lives that ultimately don’t qualify for coverage; the promise of more assured commissions has attracted intensifying competition, notably from cloud-based intermediaries[24] – one broker commented that small group commission rates of mid-teens from just a few years ago have compressed to 5%-6%.[25] Paychex, after years of 7-9% insurance services client growth from 2009-2012, is retreating from small group benefits after growth flattened in recent years.
Some brokers believe (hope?) that higher-than-expected loss ratios in public pools[26] -> more onerous future pricing/reduced carrier participation -> small employers re-integrating employee healthcare provision or, at the very least, soliciting broker advice amidst the chaos.[27] We’ll see. I generally think that small group benefits lacks value-added differentiation relative to commercial insurance and is becoming more intensely competitive.
Management
The Brown family’s influence has seeped unimpeded through several generations into present day Board and management, as well as Southern U.S. politics and business.
J. Hyatt Brown, chairman since 1994 and 14.9% owner of the Company, took over the business from his father who founded the Company and was Brown’s CEO from 1993 through 2009. His son, J. Powell Brown, current CEO, has been at BRO in various roles since 1995; Powell’s brother, Barrett, is a Sr. VP. You get the idea.
Half the Board’s directors have been so since the ’90s[28] and are septua/octo-genarians that look more at ease in a senior citizens community; over half the Board from 2000 still remains intact. Meanwhile, 7/10ths of the management team – with an average age of 55, a comparatively younger bunch – have been with Brown since the ’80s/’90s[29] and have served as profit center leaders at some point in their careers. The freshest executive, CFO Andrew Watts, joined the Company in early 2014, replacing a retiring CFO who had been with the Company since 1992. Vesting periods for stock incentive grants of seven years – a reprieve from the 10 to 15 year vesting period prior to 2013 – speak to the Company’s long-term orientation.
But longevity is hardly an unalloyed positive. Lengthy corporate histories entwined with family lineages often come with mandatory disquieting governance anxieties, and Brown is unfortunately no exception. There are, count ’em, 12 Board members[30] whose CVs read like a “Who’s Who” of Florida/Georgia politics and business. Overlapping Board memberships and various (but mild) value-leaking related-party transactions are recurring decade-long themes.[31] I don’t love this. That said, the Brown clan has the vast majority of its wealth embedded in its 15%+ ownership of a Company that has donned its family name for nearly 80 years; it’s difficult to conceive of a more personal and economic motive for optimizing long-term value. So while management and the Board are insularity personified, on the whole, I take comfort in the same impermeable cultural bubble that has conservatively accreted value over the decades.
Capital Allocation
Continued expansion of shareholder value will depend significantly on continuing NPV+ acquisitions and share buybacks. Because industry retention rates are so high (90%-95%), meaningful organic market share shifts aren’t common and acquisitions are an oft sensible growth path.
For context, from 2004 through September 2015, Brown acquired $1.3bn in annualized revenue (nearly 3/4 of current consolidated run-rate of $1.7bn) using a combination of cash and earn-outs[32] and always staying well inside responsible leverage thresholds, perhaps to a fault.[33] The Company mostly purchases assets[34] with tax-deduction attributes and since at least 1997, BROhas not taken a single intangible asset impairment, a conceit that no other public peer can claim. Strategically, Brown has established local market density by acquiring regional platform “hubs” and folding in smaller, adjacent agencies and true to its decentralized form, rather than manage the process from HQ, Brown delegates the search for potential targets to local office leaders and regional executives before engaging its internal M&A team.
The Company’s profit obsession guides its takeout approach – the CFO explained to me that acquisitions are charged an explicit, de-escalating cost of capital[35] and that fanciful but fleeting pro-formas to hit earn-outs are disallowed. Prerequisiting every deal are joint agreements specifying sustainable post-acquisition profitability targets that ramp to profit center margins within 2-3 years, a goal that has been credibly demonstrated over time.[36]
Historically, management has been opportunistic, aggressively capitalizing on attractive multiples in 2008 before recently orienting its attention to buybacks as unprecedented globs of private equity capital have flooded the agency landscape, displacing valuations up to and somewhat above 10x. By comparison, in 2008, the Company used all of its operating cash flow to aggressively acquire small retail agencies at 5.5-6.5x EBITDA when its own stock was trading at ~8x.[37]
Brown’s retail fold-ins typically see meaningful revenue and cost synergies through cross-selling opportunities, carrier leverage and overhead reduction. Its platform affords acquired brokers, who have typically managed just one or two exposures for clients, access to an array of risk packages through expanded carrier relationships, in addition to back-office support that allows a more concentrated effort on sales and relationship management.
At 1.3x net debt to EBITDA, BRO is deeply uncool in today’s levered platform parade. Recent financial engineering feats that maximize balance sheet efficiency at the expense of redundancy that veil tricky but paramount assessments of moat depth behind precise theoretical levered returns are just the pits, really, travesties in risk management. But Brown is not that.
Given the Company’s recurring revenue base, stable cash flows and variable cost structure, it could boost leverage to the high-end of its stated 1.5-2.5x comfort band to effect accretive acquisitions and buybacks without much incremental risk to the equity: moving to 2.5x (today) means another $500mn or so in debt, bringing total interest expense to $56mn against LTM EBITDA of ~$550mn (nearly 10x coverage).
Assuming 10% organic revenue declines – worse than any decline experienced during 2008/2009 – at far-too-onerous 60% decrementals, still leaves us with $450mn in EBITDA (and ~8x coverage) with sufficient discretionary free cash flow to delever back to 2.5x within a year.[39][40]
Still, with acquisition multiples drifting towards 10x+, the foregone opportunity of repurchasing BRO’s stock at 9.5x gets costlier and management has redirected its capital allocation focus. Until recently, the company hadn’t repurchased shares for treasury since at least the ’90s; it never made sense because its stock has almost always traded at a hefty premium to smaller brokers – until now.
Over the last 1.5 years, the Company has repurchased ~4% of its shares[41] while raising its remaining authorization to $450mn (10% of shares outstanding), by far the largest in company history.[42] On November 11, the Company announced another accelerated repurchase program in the amount of $75mn (another 1.7% of market cap).
Going forward, I expect a mix of buybacks and acquisitions, with the lower-multiple option exerting stronger pull on capital as the valuation disparity widens. I sketch the per-share blessings of levered buybacks and acquisitions in the “Scenarios” section.
Organic Growth[43]
Broker commissions are a function of written premiums, which in turn are the product of: 1) premium rates (price of insurance) and 2) insurance exposure units (the amount of insured stuff – sales, payrolls, vehicles, inventories, properties, etc). If you look at a chart of mapping the growth rate of commercial lines net written premium growth[44] since the ’70s, you’ll see that the great preponderance of data points fall north of “0,” with mid-single digit rates punctuated by recrudescent hard markets that drive net premiums 20%+ higher for a year or two. Insurance is a market where stable demand (exposure units) intersects with touch-and-go supply (pricing). You wouldn’t know it from this graph, but eight out of the last 14 years and 21 out of the last 30 were soft markets.[45] Commercial prices today are about where they were in 2000, unadjusted for inflation.
The brokerage industry’s incessant fuss over rates disguises a more mundane but convincing exogenous arbiter of brokerage industry growth: general economic activity. Brown’s management believes that historically 2/3 to 3/4 of its organic growth has been driven by exposure unit changes as opposed to pricing. The chart below generally validates this claim[46] but with an important caveat: the influence of commercial insurance pricing on Brown’s organic growth is most pronounced during periods of sudden and dramatic rate changes (>10%). In flat to soft-ish pricing environment (-7% to +7%) like the present, insured clients mostly stick with their carriers and brokers, and organic growth hugs the green line more tightly. In any case, industry growth never quite matches rate changes as movements along the demand curve attenuate full pass-through (corporate risk managers typically stay within budget bands, reducing risk units or raising deductibles as prices elevate and vice versa).
But whatever, while BRO’s organic growth has certainly exceeded commercial insurance pricing over time, it has lagged peers. Here are the main culprits:
1) Brown is struggling in small group benefits (5.5% of revenue). The public exchange disintermediation that I discussed above was recently exacerbated by regulation in the State of Washington that resulted in the termination of several health association plans,[47] impacting retail segment organic growth/EBITDA margins by at least 60bps/30 bps this year. Based on my conversation with the CFO, this was an isolated termination that will be anniversaried in 2016. As previously mentioned, I am expecting unabated small group benefits challenges; still, even eviscerating all $90mn in small group business at onerous contribution margins would only dent LTM cash earnings by around 8-9%.
2) Relative to peers, BRO is over-indexed to coastal property, an air-pocket of 15-25% rate declines within an otherwise stable P/C complex.[48] I estimate that roughly 8-9% of the Company’s core commissions are linked to coastal property, a ~1% headwind to organic growth.[49] The absence of storm activity has also hurt Brown’s third-party claims administration and Wright Flood Insurance businesses, which have operated at depleted profitability post Superstorm Sandy.[50]
While these organic growth detractors have featured prominently in sell-side reports, their combined impact on earnings power (2-4% of LTM earnings) seems rather trivial when explicitly quantified and mundane when placed in context of assorted challenges the Company has periodically encountered over the last 15 years. Nonetheless, the Company has recently taken action to combat these headwinds.
The Board recently re-engineered significant annual cash incentives that binds management compensation to newly introduced organic revenue growth targets, a refreshing pivot from past freebees. Prior to 2015, annual cash incentives were only ostensibly linked to earnings growth – executives were awarded 100% of a “target cash incentive amount” even with flat income growth, with a maximum payout of 115% and a reasonable minimum of 90%.[51] This year, the payout percentages range from 0% to 200%, so there’s far more risk and reward to missing and meeting goals. The dollar payouts are meaningful, with the portion tied to organic growth (40% weight) alone amounting to nearly 100% of the CEO’s base salary.
This change in compensation policy preceded a recent organizational realignment in which the retail brokerage segment was decentralized into six regions to sharpen product focus and more closely align incentives with accelerated organic growth and profitability by region. For example, in addition to overseeing an assigned territory, each regional leader will be responsible for developing strategy around a key initiative – one regional leader will focus on small business/personal lines, another employee benefits and so on.
Finally, for what it’s worth, leading indicators[52] show accelerating economic activity in Brown’s most important markets.
Scenarios
Note: You may find it helpful to peruse Appendix: Company And Segment Overview prior to reading this.
What follows are my estimates of where the Company’s stock might trade two years out in various states of the world, an entirely different exercise than handicapping BRO’s fundamental worth. Marrying disciplined capital allocators with an annuity-like asset can create value counter-cyclically (assuming Brown’s moat remains intact); in what you might call one of them good problems, during deep cyclical downturns precipitating multiple contraction, BRO can aggressively repurchase shares and roll-up distressed competitors. In ebullient times, management can reinvest in the business and fortify its balance sheet in anticipation of the inevitable downturn. Cycles come and go, competitive advantages and resource allocation are more enduring; and for a business constantly inundated with cash, moats + management are far more pertinent to long-term value creation. In that spirit, the real downside case ties itself to the following categories:
1) Misallocation of capital: CEO J. Powell Brown has been with the Company since his late 20s. Debuting as a lowly account executive and plowing through roles of intensifying responsibility, he at least appears to have been denied the most palpable blessings of nepotism. While management has made several chunky acquisitions over the last 3-4 years,[53] they’ve been thematically consistent with adjacent platform assimilations that have nudged the Company into services, programs and wholesale lines over the decades and seem synergistically sensible. So far, the large acquisitions in recent years – Arrowhead (2012), Beecher (2013) and Wright (2014) – have generated unlevered returns in excess of capital costs, been integrated at ~Company-average margins, and have led organic growth.
2) Disintermediation creep: In Innovator’s Dilemma, Clayton Christensen cogently argues that disruption can occur when incumbent solutions overshoot a market’s threshold needs just as previously inadequate alternatives meet them at lower price points. Organizational constructs that limited pursuit of lower-tier, unprofitable revenue while scaffolding success in larger markets, now render the incumbent vulnerable to viable competition from the heretofore less sophisticated bottom dwellers.
The scale advantages of two-way markets, in particular, can be persistently stable until they’re suddenly unglued and it’s conceivable that competitive forays in granular, homogenous risk pools firm a base for higher-order disruptions. One potential narrative is that the Brown’s commission-loaded market-marking function is piecemeal usurped, forcing it to increasingly rely upon lower-margin consulting fees in a domino fall that looks something like: small group benefits (where it’s already happening)-> worker’s comp -> large group benefits… or personal auto -> commercial auto -> commercial property… Besides the natural forces of competition, legislatively mandated single-payer universal health care is a fat disintermediating tail and would directly jeopardize 15% of the Company’s revenue (and perhaps 20%+ of earnings power).
Technology has nay-said the Company and its industry since the first tech boom and at least up to the present, Brown has consistently demonstrated that human relationships and insurance-specific expertise remain highly relevant. Paychex and ADP, firmly embedded in outsourced automated HR/payroll functions[54] for SMEs and presumably best positioned to offer adjacent services, have had surprisingly little success brokering insurance products. Broker channel checks suggest that Zenefits is witnessing enormous churn and a recent Wall Street Journal article claims that the company has missed its $100mn revenue target by more than half while Fidelity has marked down the value of its investment by 48% between August 1 and September 30.[55]
Base Case
My base case ties organic growth rates to current coincident and leading economic growth indicators in BRO’s most important states and assumes that coastal property rates continue to decline 15-20% while P/C pricing, in aggregate, remains range-bound. Coalescing management commentary from conference calls and annual reports, I’ve discerned exposure lines where possible. In aggregate, I’m expecting <3% organic growth over the next several years, translating into flat EBITDA margins. Given management’s and broker industry commentary on frothy M&A conditions, coupled with a doubling of the Company’s share repurchase authorization, I assume BRO reduces its M&A appetite from historical levels and pays dearer prices of around 10-11x EBITDA while dedicating an increasing amount of cash flow to retiring shares. Net leverage is modestly increased to 1.8x.
LTM 2017E EBITDA: $603mn
LTM 2017E cash EPS: $2.79
Exit cash ROE: 12.3%
Sept. 2017E target valuation (using average valuation multiples during periods of comparable organic growth over the last 10 years):
Implied stock price @ 15x cash earnings: $41.79
Implied stock price @ 9.5x EBITDA: $36.39
Average: $39.39
Bear Case
The economy stutter steps into a 2008/2009 style recession amidst unmitigated softness in commercial rates. The Company’s cost cuts do not quite keep up with its falling top line[57] and margins contract. Smaller brokerages reset their lofty valuation expectations, empowering BRO to opportunistically consolidate at somewhat more favorable multiples of 9x (still much higher than the ~6x seen during the last recession), somewhat buttressing organic profit declines.
LTM 2017E EBITDA: $499mn
LTM 2017E cash EPS: $2.27
Exit cash ROE: 10%
Sept. 2017E target valuation (using average valuation multiples during periods of comparable organic growth over the last 10 years):
Implied stock price @ 11x cash earnings: $24.93
Implied stock price @ 7.5x EBITDA: $20.31
Average: $22.62
Bull Case
Turbulent weather events interrupt a decade+ of depressed loss ratios, policyholder surplus is scarred, and coastal property rates reverse their downward trend, bolstering core brokerage commissions and TPA revenue while denting high-margin profit-based commissions. Better pricing, together with exposure growth, fuels organic growth to ~6.5%, driving modest EBITDA expansion.[58] BRO levers its balance sheet up to 2.4x EBITDA to acquire companies at 10x-11x and repurchase 18% of its shares.
LTM 2017E EBITDA: $674mn
LTM 2017E cash EPS: $3.26
Exit cash ROE: 18%
Sept. 2017E target valuation (using average valuation multiples during periods of comparable organic growth over the last 10 years):
Implied stock price @ 17x cash earnings: $55.41
Implied stock price @ 10.5x EBITDA: $46.85
Average: $51.13
Appendix
Company And Segment Overview
Retail (51% of LTM revenue; 48% of LTM EBITDA): see “Insurance Brokerage Industry Overview” segment. While the Company primarily targets small to mid-sized businesses, it has bolstered its large account presence, with a particular emphasis on group benefits. Between the acquisitions of Beecher Carlson (July 2013; $364mn), Pacific Resources Benefits Advisors (May 2014; $99mn; double-digit revenue growth over the last five years and 98% retention), and Strategic Benefit Advisors (June 2015; $64mn), I estimate that large accounts constitute nearly 7% of total BRO revenue (14% segment revenue). Management emphasized to me that within large accounts, Brown does not directly compete against AON/MMC/WSH, but instead surgically focuses on unique, commission-abundant placement engagements.
Significantly, these acquisitions bring solutions that bolster Brown’s existing middle-market capabilities. For example, Beecher’s strong cyberinsurance presence has been successfully adapted and cross-sold and its proprietary databases and predictive analytics are offered as preventative maintenance solutions to reduce future claims. Pacific Resources, meanwhile, has introduced fuller ancillary offerings to Brown’s upper-middle-market clients. Approximately 84% and 16% of segment revenue is commission and fee based, respectively.
The next two segments, National Programs and Wholesale, function as market access providers for third-party retail brokers looking to place risks on behalf of clients. Retail brokers, particularly newer and smaller ones that don’t have the minimum volume in certain specialty lines to directly interface with carriers, access these intermediaries to place client risks that fall outside their core industry focus, better enabling them to compete with larger agencies. For example, a retail broker that specializes in restaurant professional liability can place workers’ comp risk for a one-off dental practice.
Programs (26%; 31%): Brown functions as a managing general agency, wherein the insurance carriers delegate underwriting authority to the Company (Brown selects the program risks and sometimes adjusts claims and collects premiums) for policies catering to professions and trade groups like dentists/lawyers/architects/municipalities/CPAs.[59] The Company distributes policies through both its own network and independent agents and is mostly compensated through commissions.
The two largest businesses within Programs are Arrowhead (a standard MGA with a large presence in southern California whose insured risk pools include commercial package insurance for automotive aftermarket, architects and engineers, quake, workers comp for select industries) and Wright (a national flood underwriter), both recent acquisitions that I estimate contribute 36% and 24% of segment revenue, respectively, and have generated > segment organic growth.
Wright requires some explanation.
In May 2014, Brown acquired Wright Insurance Group for ~$550mn.[60] As the largest participant in FEMA’s “Write Your Own” Program (WYO)[61] with 19% market share, Wright Insurance, while nominally a flood insurance carrier, is economically a commission-based service provider for the National Flood Insurance Program; that is, Wright does not bear underwriting risk. Flood insurance rates have been increasing at 7% annually over the last 10 years and legislative proposals to bring rates up to actuarial sound levels portend further improvements.[62]
A class action lawsuit was filed a year ago against Wright and U.S. Forensic, a third-party engineering firm contracted by Wright to assess certain Sandy claims. It alleges that engineering reports were manipulated with the intent to underpay claims for “hundreds” of policyholders. A number of WYO flood carriers are under similar scrutiny. A panoply of questions, including who, if anyone, bears culpability (the contracted engineering firm that allegedly falsified reports, the carrier who engaged it, or FEMA) remain outstanding.
Despite the political grandstanding and media coverage, underpayment of Sandy claims from bogus assessment reports seems rather inconsequential in perspective. The 1,500 payments-related Sandy cases being heard in New York represent about 1% of all Sandy flood claims and less than half of that 1% are related to the engineering review process in question.[63] It appears that the lead plaintiff in the class action was underpaid by ~$150k. Multiplying these proportions by this payout through the 20k Sandy claims processed by Wright gets us to a $15mn true-up, ~2.5% of EBITDA. Assuming another 4x that in punitive damages results in a total liability of $75mn, less than 2% of BRO’s market cap.[64]
Besides the standard legal boilerplate that management has included in its filings professing immateriality of lawsuits, here are a few more assurances for you: A.M. Best reaffirmed Wright’s A- (“Excellent”)/Stable rating in July; FEMA renewed Wright’s WYO carrier status in October; and “no new legal proceedings, or material developments with respect to existing legal proceedings” have occurred through 3Q15.
Wholesale Brokerage (14%; 16%): This segment sells excess and surplus commercial insurance[65] to retail agencies on a commission-basis. Of all Brown’s segments, wholesale is most closely tied to coastal property,[66] which, in light of the 15-25% coastal pricing declines makes this segment’s high-single-digit organic revenue growth and company-leading 36% EBITDA margins that much more impressive.
Services (9%; 6%): Provides insurance services for fees that are not directly tied to general premiums. The two main businesses here are choppy, high-margin claims administration[67] revenue and fees for Medicare services. The former gifted and subsequently thieved accelerated organic revenue growth and margin expansion post-Sandy,[68] and, given the absence of major storms, currently operates at depressed levels.
Compared to BRO, the market has rewarded AJG’s faster organic growth with more generous earnings multiples in recent years while ignoring the former’s consistently superior profitability. Brown’s employees are paid a smidge less than Gallagher’s, but generate comparable productivity on lower overhead, driving a higher profit spread per employee.[69] If the last decade is any guide, Gallagher must deliver 50% more revenue than Brown to generate the same EBITDA dollars.
———————————————
[1] Brown’s amortizable intangible assets consist of purchased customer accounts and non-compete agreements from acquisitions. These are non-cash/non-economic charges that I add back to GAAP earnings to arrive at a truer measure of profitability. At ~$0.60 per share vs. $1.70 in LTM GAAP earnings, this adjustment is meaningful.
[2] Applying 80%/10%/10% weights on base/bull/bear case scenarios.
[3] 2014 Business Insurance survey.
[4] Agents technically represent insurers; brokers, insureds….but the functional distinction is blurry and I use the terms interchangeably.
[5] The 100th largest broker generated $26mn in commissions according to the 2014 Business Insurance survey.
[6] Most agencies have a mix of personal and commercial lines. I calculate the number of commercial agencies by multiplying the number of agencies in each revenue cohort by each cohort’s mix of commercial revenue – think of it as a “commercial agency equivalent” number. My dollar value estimate is calculated as the product of commercial agency equivalents and the mid-point revenue of each revenue cohort.
[7] Source: 2014 IIABA Best Practices Study. On average, for agencies that generate between $2.5mn and $10mn in revenue, the largest shareholder has close to 60% ownership and is around 57 years old.
[8] The Company estimates the fair value of earn-outs on acquisitions, which are reflected on the balance sheet as part of the purchase price. Changes in estimated value flow through the income statement as non-cash charges/gains. Historically, these changes have been nominal and I exclude them from EBITDA. I include the fair value of earn-outs in the enterprise value.
[9] Adrian Brown, who founded the Company in 1939 with his cousin Charles Owen.
[10] Roberts, Sally. “Longtime agency chief J. Hyatt Brown retires.” Business Insurance. Web. 5 July 2009.
[11] (Through grants, open market purchases, or participation in the Company’s employee stock purchase program).
[12] By comparison, management and the Board at competitor Arthur J Gallagher together own less than 1.6% of shares.
[13] Brown’s in-house sales and leadership program.
[14] For example, a broker might place construction worker’s comp up to a threshold liability with one carrier and excess layers with another.
[15] A June 2013 Boston Consulting Group Commercial-Insurance survey shows that for a typical US insurer, 80% of premiums are derived from 20% of brokers/agents.
[16] Businesses with between 20 and 1,000 employees. Brown & Brown – J.P. Morgan Insurance Conference, March 18, 2015; U.S. Census Bureau; U.S. Small Business Administration.
[17] Personal auto, for instance. With Americans logging over 3 trillion vehicle miles per year, there are robust datasets on claims experience and accident frequency across demographics and geographies.
[18] Umbrella liability policies, in particular, can vary wildly from one carrier to the next depending on risk type and industry, and are often negotiable.
[19] Hoying, et al. (Nov 2014). Mining the Untapped Gold in SME Commercial Insurance. The Boston Consulting Group, 7-8.
[20] A business owner who reconciles his personal taxes with Turbotax will still outsource those of his 40-person business to an experienced CPA.
[21] Hoying, et al. (Nov 2014). Mining the Untapped Gold in SME Commercial Insurance. The Boston Consulting Group, 5-6.
[22] In 2012, personal lines insurers GEICO, State Farm and Progressive were among the top 25 most advertised US brands, edging out Home Depot and Budweiser; this, according to the Ad Age Datacenter analysis of U.S. measured media spending from Kantar Media.
[23] BRO defines small group as < 100 employees. Organic declines in small group have been offset by growth in its large group business.
[24] (Who have mostly seen success in small businesses with fewer than 50 employees). Perhaps the most salient example is the hyperbolic growth of Zenefits, a San Francisco-based cloud software company that brokers health insurance for small businesses at a 5% commission rate. In California, the company is the largest Anthem broker for companies with fewer than 50 employees. Mind you, Zenefits’ growth profile says nothing about its ultimate efficacy as a business. Several brokers I contacted believe that this “software company disguised as a well-informed consultant/broker” is experiencing significant customer churn as clients become increasingly disillusioned by the lack of benefits expertise and service. With < 10% of Brown’s revenue and firmly negative profitability, Zenefits’ last funding round valued the company at $4.5bn, 85% of Brown’s total enterprise value. That I think this excessive may speak to my lack of imagination; at a similar revenue multiple, BRO would be worth…just kidding. Benefits brokers are combatting the Zenefits threat by increasingly white-labeling cloud-based interfaces of their own.
[26] In its most recent quarter, ANTM witnessed a 30% “downward migration” relative to its expectations as the company continues to lose share to competitors who are pricing risk uneconomically and unsustainably.
[27] Public exchanges require scale and full participation to function effectively and current estimated public exchange enrollment for 2015 of 9mn-10mn lives is well short of the Congressional Budget Office’s original estimate of 15mn. UNH recently announced that it is considering withdrawing from exchange participation after major losses from policies sold through the exchanges. From Stephen Hemsley, UNH CEO on 11/19: “In recent weeks, growth expectations for individual exchanges have tempered industry-wide, co-operatives have failed, and market data has signaled higher risks and more difficulties while our own claims experience has deteriorated…”
[28] Including Toni Jennings, who took a hiatus from 2003-2006 to serve as Lieutenant Governor of Florida.
[29] J. Powell Brown (joined in 1995); Sam R. Boone (1987); Linda S. Downs (1980); Richard A. Freebourn (1984); Robert W. Lloyd (1999); Charles H. Lydecker (1990); J. Scott Penny (1989); Anthony T. Strianese (2000); Chris L. Walker (2003); R. Andrew Watts (2014).
[30] c.f. 15 at AON and 13 at MMC, significantly larger and more complex global entities.
[31] $12k to the Chairman for business entertainment expenses and club membership dues; a forgivable $500k loan to P. Barrett Brown, an SVP and brother of the CEO; $141k in fees for corporate aircraft owned by a family managed LLC are some notable ones.
[32] BRO has not used its stock as acquisition currency since 2001.
[33] From 1989 through 2013, BRO’s net leverage ratio ranged from -1.1x to 0.7x.
[34] As you might expect given the brokerage industry’s people-heavy/asset light structure, most of the purchase price on agency acquisitions is assigned to goodwill and intangibles.
[35] He wouldn’t reveal the number, but I estimate it to be originally set at around 6%-7%, pre-tax.
[36] The table up there is somewhat misleading in that it co-mingles contribution margins and acquired margins; but given the lackluster organic growth over most of these time spans and the high variable cost nature of the brokerage business (i.e. low operating leverage), the table should be reasonably representative of acquired margins.
[37] “2008 was the third largest in company history with $115.4 million in forward annualized revenues. Forty-three of the 45 transactions were in the property and casualty and employee benefits retail agencies. Perhaps the most important quality of these acquisitions is that the earnings performance are in line with our expectations and margins comparable to the existing operations….In 2008 we continued to strength our M&A transaction capability. We added to our staff increasing the number of individuals in our legal, financial, and quality control teams to handle an increased number of transactions given the opportunity.” – Jim Henderson, BRO COO; 4Q08 Earnings Call, 2/17/2009.
By comparison, in 2007, when Brown’s stock was trading at ~9.5x, acquisitions were executed at 6x-7x, translating into high-teens after-tax unlevered returns.
[38] Target productivity and margins reflect those of an independent agency in the $2.5mn-$5mn bucket per the 2014 IIABA Best Practices Survey.
[39] BRO’s current leverage ratio is well below peers and unlike AJG, AON, MMC and WSH, the Company has no pension liabilities.
[40] The most onerous debt covenant requires a net debt to EBITDA ratio back to 2.5x within 12 months of a leverage event.
[41] (Most have been done under accelerated share repurchase programs at a weighted average price of $32.13).
[42] (In absolute dollars and as a percent of market cap).
[43] BRO defines organic growth for core commissions and fees the same way an honest retailer defines “same store sales” growth. It excludes contingent commissions and large books of business from newly hired producers.
[44] Gross premiums less premiums ceded to reinsurers; primary rates mirror reinsurance pricing over time.
[45] Soft markets are those characterized by falling insurance rates.
[46] Even in a soft rate environment like 2004-2005 and 1998-1999, BRO posted positive organic growth as a strong economy translated into more insured units.
[47] Association Health Plans allow small employers in the same industry to pool their risks, taking advantage of scale economies in buying to offer health benefits to their employees. To qualify, an association must meet two criteria; it must not: 1) exist solely for the purpose of selling insurance to its members (the “bona fide” association hurdle) and 2) charge different rates for different risk profiles. Early this year, the State of Washington disapproved a whole slew of these plans for violating at least one of these two rules.
[48] The precipitous price declines – a function of 1) catastrophe-absent storm seasons driving record low loss ratios and record high carrier surpluses and 2) yield-starved private equity / hedge funds capitalizing alternative insurance vehicles – have persisted for several years.
[49] An overlooked silver lining is that ~3.5% of Brown’s revenue and ~8% of EBITDA comes from high-margin profit-sharing commissions tied to carrier profitability (which, in turn, is negatively correlated with storm activity).
[50] Services segment (9% of revenue) LTM margins of 23% vs. 30% in 2013.
[51] From the Company’s Proxy filed 3/27/15: “The cash incentive amounts for Messrs. Powell Brown, Watts and Penny were calculated based on the following formula: [target cash incentive amount] times [100% plus the percentage change in earnings per share, without regard for change in acquisition earn-out payables and adjusted to exclude the net after-tax effect of those sales of offices that occurred during the fourth quarter of 2014].”
[52] Each state’s Philly Fed’s Leading Economic Indicator is meant to be to lead its Coincident Index by 6 months. Per the Philly Fed website,Leading Indicator = Philly Fed Coincident Index + state-level housing permits (1 to 4 units), state initial unemployment insurance claims, delivery times from the Institute for Supply Management (ISM) manufacturing survey, and the interest rate spread between the 10-year Treasury bond and the 3-month Treasury bill.
[53] These seem atypically chunky against the last 10 years but rather unremarkable in the context of the last 20.
[54] PAYX and ADP have nearly 600k and 600k+ clients, respectively.
[55] Winkler, Rolfe. “Highly Valued Startup Zenefits Runs Into Turbulence.” The Wall Street Journal 12 Nov. 2015: n. pag. The Wall Street Journal. 12 Nov. 2015. Web.
[56] Green/grey/red = bull/base/bear.
[57] I assume cost cut / revenue decline ratios comparable to 2008/2009.
[58] To just 33.6%, still at the lower end of management’s nebulous long-term 33-35% target.
[59] BRO manages over 50 programs w/ 40 carriers.
[60] $120mn in annual revenue, $76mn of which represented flood insurance and resides in the Programs segment.
[61] A cooperative arrangement between the P&C industry and FEMA in which 80 participating private carriers underwrite and process claims under their own banners but cede the risk to the federal government. The carriers receive expense reimbursement and commissions for every policy it sells.
[62] Around 20% of the flood market is operating at subsidized, actuarially unsound rates.
[64] Hugely reductive legal analysis, I know…I’m simply trying to scope the dimensions.
[65] (Quirky, unusual risk – excess workers’ comp, garage, inland marine, jewelry – that is hard to place in traditional markets)
[66] I estimate ~1/3 of commissions.
[67] TPAs act as an extension of an insurer’s claims department, providing critical processing capacity for claims payments and customer service during disasters, when carrier resources are strained.
[68] Segment organic growth in 2012/2013/2014 were 8.6%/12.2%/-8.1% while EBITDA margins were 26.3%/30.4%/22.8%.
[69] Brown offers employees a more generous purchase discount on stock purchase plans, which is not reflected as compensation on the income statement. Adjusting for this, however, does not make a material difference.
[70] Brokers are variable cost heavy, so the contribution margins relative to extant ones on low-to-single digit organic growth are quite nominal. Plus, drawing from AJG management comments, I believe the organic growth bogey for margin expansion is higher at AJG than it is at BRO, and even if that weren’t the case and Gallagher’s greater organic growth profile were in fact yielding strong contribution margins, it would only make my hypothesis – that AJG is acquiring companies with substantially and sustainably lower pro-forma margins than BRO – stronger.
[71] Per AJG 2Q15 earnings conference call.
[72] “Let’s call it what it is. There are a lot of acquirers out there, some of whom are paying what we might consider ridiculous prices in certain transactions.” – J. Powell Brown, CEO of BRO (2Q15 Earnings Conference Call
“…it is a competitive market, but I would say the difference is really when you look back four or five years ago, the multiples were lower than they are today, so it’s very important for us to understand that.” – Daniel S. Glaser, CEO of MMC (3Q15 Earnings Conference Call)
“It is true that certain assets are being priced up particularly those where the private equity industry is also a potential buyer. So, you have obviously seen some of the things going on and going around the North American regional brokerage market where you often do see very, very high prices being paid.” –Dominic Casserley, CEO of WSH (3Q15 Earnings Conference Call)