[TripAdvisor, Trivago, OTAs] Thoughts on the Carnage
Posted By
scuttleblurb
On
In
SAMPLE POSTS,[TRIP] Tripadvisor,[TRVG] Trivago |
1 Comment
Trivago’s “relevance assessment dimension”, implemented in late 2016, is an algorithmic adjustment that compels hotel advertisers to improve their landing sites and booking engines if they want to rank higher in trivago’s search results. The idea is that while the user experience starts with a room search on trivago, it extends to when she clicks off to actually book the room on the advertiser’s site…so if the advertiser screws up that last step (according to trivago), it will have to pay more for each referral. One consequence of this change was that trivago penalized OTAs whose links sent users to yet another page of search results on OTA.com rather than directly to the property that the OTA listed on trivago.
While trivago technically has 200+ advertisers competing for placement in its marketplace, two of them, Expedia and Priceline, respectively comprise 36% and 43% of the company’s revenue. [Expedia acquired 63% of trivago from early investors in 2013 and continues to own 60% of the company post its December 2016 IPO]. It’s usually not a good idea to behave like a powerful aggregator towards two dominant customers who actually are powerful aggregators when you, actually, are not…but that’s essentially what trivago did, tasking its algorithm to extract the most value from advertisers in zero-sum fashion while providing CRM, bidding, and booking tools for smaller hotels – including “express booking” where trivago actually hosts the booking site on behalf of the advertiser – to compete more effectively against the OTA giants with the aim of stoking greater bid density and pushing the agencies, in trivago’s own words, towards “the pain points of their profitability targets.”
In the first several quarters after implementing relevance assessment, trivago saw qualified referrals ~+60% y/y and revenue per qualified referral (RPQR) growth of +4%-4.5%. The company admonished that RPQR would be lower (or, euphemistically, “normalized”) in the second half of 2017 since as advertisers adapted their sites to trivago’s relevance assessment standards, they would be not be required to bid as much for traffic. No big deal. But then things took a turn for the worse. On 9/6/17, trivago announced that revenue growth for the full year would be more like 40% instead of 50% and EBITDA would be lower than guided too, as the RPQR hit turned out to be worse than expected.
The charitable interpretation to this bleak outcome, the line that management continuously parrots to investors, is that by optimizing the user experience, trivago is nobly sacrificing near-term profits for the sake of long-term gain. Management understands that having loyal users is the key to spinning up a platform that gives you license to marginalize suppliers (advertisers, in this case), and so trivago is splurging on TV advertising [over 90% of the company’s revenue is dedicated to sales and marketing], assiduously monitoring the results, and iteratively tweaking campaigns towards the aim of building brand value. At the same time, by adjusting its bidding algorithm and forcing suppliers to play ball, it is ensuring that users have the most seamless search and booking experiences possible.
But it’s not clear to me why Trivago feels uniquely positioned to accomplish the task of creating memorable ads or whatever it is that they think drives persistent site visits. Because unlike, say, a SaaS model, where the journey from site visits to free trials to paid subscriptions sucks the user into ever deeper states of captivity that can, in theory, generate sticky, layered recurring revenue streams, what is the lock-in mechanism here? At least TripAdvisor can claim authentic and current user-generated reviews. Google began with a superior mousetrap and didn’t need to spend gobs on advertising to attract users (plus, because general search is so frequently used, it is habit-forming in a way that travel-specific search is not). Trivago’s vertical search has, well…what exactly…to keep users continuously coming back once they have clicked off the site? And furthermore, what can’t be replicated? Expedia offers its own version of relevance assessment, its Accelerator program encouraging hotel properties to graduate up the Expedia listings page by paying extra commissions or by improving quality scores.
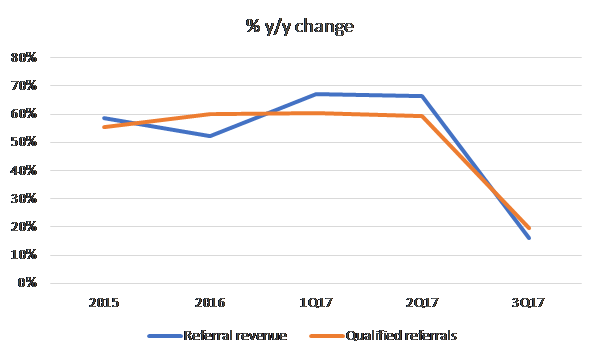
Growth in qualified referrals and referral revenue have decelerated in dramatic fashion. No bueno:
[Definition of qualified referrals from the F-1: “We define a qualified referral as a unique visitor per day that generates at least one referral. For example, if a single visitor clicks on multiple hotel offers in our search results in a given day, they count as multiple referrals, but as only one qualified referral. While we charge advertisers for every referral, we believe that the qualified referral metric is a helpful proxy for the number of unique visitors to our site with booking intent, which is the type of visitor our advertisers are interested in and which we believe supports bidding levels in our marketplace.”]
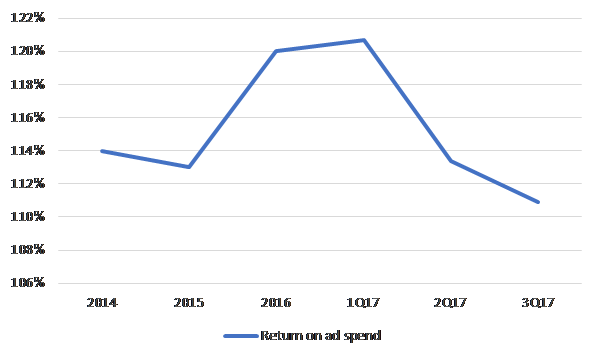
And with that, the potency of trivago’s brand advertising also appears to have waned, as the company experienced significant y/y de-leverage on sales and marketing in the latest quarter and declining returns on ad spend over the last 2 quarters:
ROAS weakness also happens to coincide with TripAdvisor’s renewed commitment to brand advertising this year, so on top of volume weakness, perhaps TRVG is also witnessing pricing pressure on ad units? [After spending $51mn on TV advertising in 2015, TripAdvisor reallocated marketing dollars to online search and spent nothing at all on TV in 2016. They’re committing $70mn-$80mn this year as part of a multi-year brand ad campaign].
If online travel were fragmented up and down the value chain, then being the first to spend aggressively on brand advertising for the sake of creating a liquid marketplace that then itself becomes the value proposition, might just work. The numbers are tempting. Global online hotel bookings of ~$145bn comprise around 1/3 of the total offline + online hotel bookings and are taking share from the offline channel. At a 15% take rate, that’s a $22bn addressable market growing low double-digits annually. On its current revenue base of $1bn, claiming even a small share of that could drastically move the dial. But the question of course is, can you grab share at compelling economics? I don’t understand the fundamental value proposition offered by trivago that cannot be offered equally well by many other top-of-funnel peers or even further down-funnel for that matter.
This is why I find I Trivago’s competitive positioning so precarious: it doesn’t possess the bargaining power to procure traffic at advantaged cost nor an irreplicable process to transform that traffic into value so compelling and unique that even their powerful customers will cede economic ground. Online travel is increasingly dominated by aggregators further downstream who have myriad acquisition channels – including Facebook, Google, and direct brand advertising – through which to lure travelers. And as in any highly competitive market, attempting to generate sustainable value off brand advertising is an unwinnable game unless there is a differentiating resource at the core.
At the Citi Tech Conference last month, when asked about competitors recently copying trivago’s strategy, the company could offer only the following effete non-statement:
“I think the only sustainable competitive advantage that you can have is to continue to be ahead of your competition. And so, the competitive response is to continue to innovate in marketing and in product and make sure that there is always a gap between yourself and competitors that are copying what has worked very well for you. I think that sounds generic, but I think that’s the only thing you can do.”
TRVG’s management maintains that its can sustain 25% EBITDA margins at some point (better than Expedia’s high-teens EBITDA margins). I doubt it.
TripAdvisor is the Twitter of online travel: a unique, hard-to-replicate asset that eludes monetization but has significant strategic value. There’s clearly a double marginalization problem to be solved via vertical acquisition, which TRIP Chairman Greg Maffei seems open to. And that might really be the primary reason to hold on to the stock. Well, that, plus the non-hotel side of the business (attractions + restaurants) is killing it, growing revenue by 25%-30% over the last year and solidly profitability. That business is probably worth ~$1.5bn (4.5x revenue), leaving $2.4bn in enterprise value for a hotel business, one facing revenue and cost pressures, doing around $200mn in EBITDA (after stock comp). By comparison, trivago’s enterprise value is $1.8bn, and they’re doing only $13mn in EBITDA. The value disparity makes little sense.
[Re: “hard-to-replicate”, as I previous wrote:
“Over 360mn people visit the company’s site every month to plan their trips because they trust its deep fount of nearly 500mn authentic and current user-generated reviews and 90mn photos on 7mn hotels, attractions, and restaurants. Those travelers, upon completing their trips, post their own reviews, contributing to a burgeoning body of shared knowledge that drives traffic through better search engine rankings and compels still more potential travelers to visit Tripadvisor at the start of their research process. The company further stokes participation by offering badges and other marks of distinction to particularly helpful and active reviewers. Hoteliers, well aware of Tripadvisor’s critical top-of-funnel role, make a special effort to respond to consumer reviews. If you’ve stayed at a hotel boutique, you will have no doubt been encouraged at some point to leave a review on Tripadvisor by the hotel manager, who often proudly plasters the property’s Tripadvisor rating on the front window as a point of differentiation. It would be monstrously difficult to recreate the breadth and depth of TRIP’s reviews.”]
[“Monstrously difficult”? A bit hyperbolic on my part. In theory, I guess I don’t really see why the Priceline, which already has over 135mn hotel reviews, couldn’t expand its share as it garners more direct traffic through brand advertising]
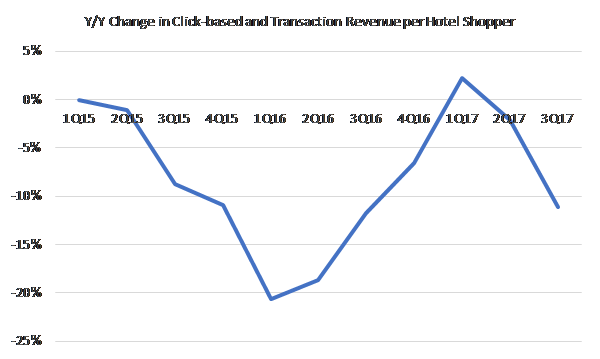
In prior quarters, the y/y decline in TRIP’s revenue per hotel shopper was largely attributed to a mix shift from desktop to mobile, a concern alleviated by the hope that mobile monetization improvement would eventually overcome such dilution. But now, bid-downs by Priceline, which is shifting ad dollars to brand advertising after years of diminishing ROI on performance marketing, have whacked monetization on the desktop side and confounded several quarters of positively inflecting trends.
After a two-year hiatus, TripAdvisor also recently began splurging on TV advertising…so, on top of getting hosed by its largest customer on the revenue side, TripAdvisor is now competing with Priceline for TV ad spots as both pursue a common goal of driving more direct traffic to their own sites. It’s hard not to be cynical about TripAdvisor’s standalone role in the value chain.
So, with trivago implicitly raising bid prices and both trivago and TripAdvisor trying (and, in the latter case, failing) to encroach directly upon bookings, it appears that Priceline is finally saying “nuh-uh” and using bid downs as part of a bargaining tactic to keep suppliers in check. Whether the shift from performance to branded advertising is structural seems inconclusive. Recent comments from Priceline CEO Glenn Fogel:
“I think one of the things very important to recognize is the dynamic nature of how the performance marketing works. So while we can make change in terms of how much money we want to spend and we where we want to spend it, our partners are also making changes all the time, and other people and auctions are making changes. So, this is dynamic and interactive, so it’s difficult to project long term what’s going to happen.”
Still, Priceline has been talking about pressure on performance ad returns for some time and even as Expedia professes loyalty towards trivago as an acquisition channel, it admits that meta search generates lower “repeat propensity” than search engine marketing. In any case, what seems abundantly clear is that TripAdvisor and trivago, who derive 46% and 79% of revenue, respectively, from Priceline and Expedia, are really in no place to dictate terms. Generating extra-normal profits as standalone entities, like the kind implied by the obligatory “small x% of big $TAM” exhibit that these guys all like to use, requires TRIP and TRVG either claiming a fair share of extraordinary surplus or an unfair share of modest surplus. The absence of a uniquely compelling value proposition impedes the former; industry structure constrains the latter.
Implicit in my TRVG/TRIP bashing, however, is that value in the this industry accrues a level below and in that spirit, Expedia could be interesting. EXPE sold off last week as the company noted that its cost structure would be larded with investments related to accelerated hotel on-boarding [3 years ago, EXPE was adding 25k-30k hotels / year, this year it’ll be 80k, and will “step change” in future years], cloud computing [a 2-3 year transition. $100mn this year, much greater than management’s guidance a year ago, growing by over 50% next year], and marketing [as management turns its attention to deepening local marketplace liquidity after years of broad-based acquisition].
Expedia isn’t the cleanest company with the strongest moat – the core OTA is dependent on Google for traffic and faces competition from a consolidating supplier base, HomeAway is up against AirBnB, tech stack integration across a slew of acquisitions appears to have been sloppy – but as the second largest OTA by bookable properties next to Priceline, the company has certainly crossed the threshold of critical scale and fostered a sustainably profitable two-sided marketplace. Disintermediation concerns stemming from an increasingly consolidated supplier base and worries about Google/Facebook aggressively moving into the space, have plagued OTAs for years…but Priceline and Expedia have done just fine as continuous investment in technology, marketing, hotel relationships, and vigorous A/B testing have congealed into a hard-to-replicate value proposition for suppliers looking to offload inherently perishable inventory and travel shoppers looking to dependably source the broadest, most relevant selection at the lowest price, with increasing participation on each side of the platform begetting buy-in from the other.
When I strip out trivago and stock comp (see below), it looks like Expedia is trading for around 11x EBITDA and 17x FCFE, which seems reasonable to me even if we grant that EBITDA growth will slow to the bottom end of the +10%-20% range (or even somewhat below) for the next few years on accelerated spending…and it looks quite cheap if we think that by weaning itself off acquisitions, dedicating itself to organically deepening engagement, broadening the platform through aggressive on-boarding, and boosting overall productivity by partly shifting its tech infrastructure to the cloud, Expedia can drive accelerated bookings growth and margin expansion 3 years out. At the very least, I think we can be far more confident that Expedia’s investments offer a reasonable return than that trivago’s continuous spending on TV commercials will ignite sustainable platform activity.
($ millions except per share data)
EXPE TEV ex. TRVG cash
19,159
TRVG stock price
$ 7.17
x # TRVG shares owned by EXPE
209
=
1,499
Adj. EXPE TEV
17,661
EBITDA ex. TRVG
1,589
multiple
11.1x
FCFE ex. TRVG
1,249
Stock comp ex. TRVG
135
EXPE FCFE ex. TRVG ex. stock comp
1,114
/share
$ 7.06
multiple
17.4x
You can also own Expedia through Liberty Expedia (LEXEA), which owns 15.5% of Expedia’s common stock representing a 51.9% voting interest in Expedia…but, I don’t think there’s a compelling “arb” here. LEXEA split off from Liberty Ventures a year ago for the purpose of Expedia eventually purchasing LEXEA’s EXPE shares. Liberty Expedia also owns an internet retailer of health and dietary supplements called Vitalize (formerly known as Bodybuilding.com), which, based on declining revenue and profits, isn’t doing so hot, and has deteriorated to such an extent that it is small enough to be unceremoniously lumped into “corporate and other”. It does around $316mn in trailing revenue with negligible OIBDA.
You are getting 0.41 shares of EXPE for every 1 share of LEXEA that you own. LEXEA also has around $5.40 in net debt / share. So the NAV breaks down like this…
NAV
Expedia
$ 50.43
Net debt
$ (5.36)
Vitalize
???
Total
$ 45.07
…vs. LEXEA’s current share price of $46. The delta between NAV and the LEXEA share price values Vitalize at around 0.2x trailing revenue. Seems fair. Whatever.
Priceline’s stock also sold off post-earnings on decelerating bookings (from ~mid-20s y/y ex. fx growth over the last 4 quarters to 16% in the latest quarter). While size constraints may translate into slower growth relative to the past, there’s plenty of runway ahead. Its largest online property, Booking.com, has an insurmountable moat in a fragmented European market [in Europe, independent lodging comprises 67% of total rooms vs. 30% in the US] where I estimate it claims around 40% of European online accommodation bookings, or about 20% of total European bookings. Globally, Priceline’s ~$80bn of total gross bookings is just 20% of online hotel bookings, or about 6%-7% of total online + offline. Room nights +19%, the number of bookable properties +41% (including vacation rentals +58%) during the most recent quarter, and the meta properties, Kayak and (more recently) Momondo, are growing and profitable. OpenTable, on which the company took a huge impairment charge last year, has sucked, but I think we’re past that. I don’t see any meaningful impediments to Priceline continuing to grow its cash earnings per share by mid-teens+ for the foreseeable future.
So yea, setting aside the takeout aspect for TripAdvisor and just evaluating these companies on their standalone long-term value creation potential, I would rather own Priceline (17x EBITDA backing out long-term investments, including Ctrip) or Expedia (11x), respectively, than either Trivago (NM) or TripAdvisor (17x).
[MTCH] Match Group
Posted By
scuttleblurb
On
In
SAMPLE POSTS,[MTCH] Match Group |
No Comments
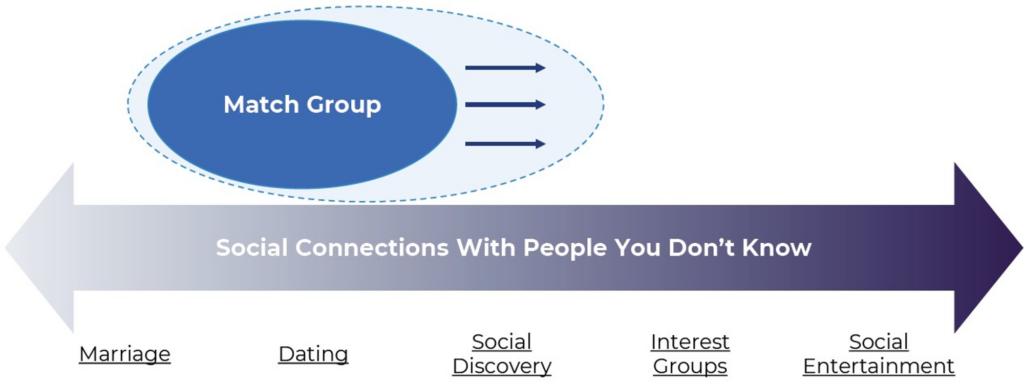
Online dating has easy parallels to other online social experiences that if taken too seriously can lead to dubious outcomes. A dating app is like social media in that there are lots of people broadcasting themselves, making connections, and seeking validation. You might “like” a photo on Instagram as you might right-swipe on a photo in Tinder or Bumble. So as Tinder, Match Group’s largest property – accounting for 66% of paying users (”payers”), 60% of revenue, and 80% of EBITDA – ballooned to ~75mn monthly active users, it must have seemed only natural to consider human relationships in a more abstract, all-encompassing way. They could not only mediate romance but “social discovery”, “interest groups”, and eventually, “social entertainment”. They could foster connections that “span geographies, demographics, relationship status and genders in ways that dating services cannot, effectively providing a much larger addressable market than dating”.
Source: Match Group; 1q21 Investor Letter
When Meta began to push entertainment over friend graph content and talk a storm about the metaverse, Match maybe felt that that was something they should think about too. Those thoughts eventually crescendo’ed into the $1.7bn acquisition (8x revenue) of Hyperconnect in 2021, the largest in its history. Hyperconnect got 75% of its revenue from Asia and operated through 2 brands: Azar, which enables one-to-one live video chat, and Hakuna, a multi-party live streaming app. Its advanced video technology could, Match believed, create a “metaverse-based experience” for social discovery and be integrated into its portfolio of apps. Meetic, a European dating app owned by Match, used the technology to launch “Live Rooms”, where small groups of people could hang out and shoot the shit. In Hyperconnect’s “Single Town”, user avatars ambled from one virtual location to the next. We now know that these metaverse ambitions, which may have seemed reasonable in the disco fog of the post-COVID orgy, were a massive overreach.
The expansion never made much strategic sense. Match was trading off a dominant position in the growing niche of online dating for a subscale position in the amorphous expanse of social media, where it was pitted against impossibly strong competitors. And you can see how an app with a reputation for facilitating hookups, when combined with a virtual goods economy and video streaming, could degenerate into a pretty unsavory place.
More than that though, people appear to want to represent different selves in different platforms. The stuff one feels comfortable sharing with potential mates on Hinge will differ from stuff they share with friends on Facebook or with colleagues on LinkedIn. Facebook Dating, which can pull in Instagram Stories and add Instagram followers and Facebook friends to “Secret Crush” lists, has famously flopped since launching in 2018. Hinge, the second largest Match property, contributing 8% of payers and 11% of revenue, soared even after it stopped leveraging Facebook’s social graph to match singles. Bumble’s derivative offerings – Bumble BFF for discovering platonic friends and Bubble Bizz for developing professional relationships – don’t appear to have gotten much traction.
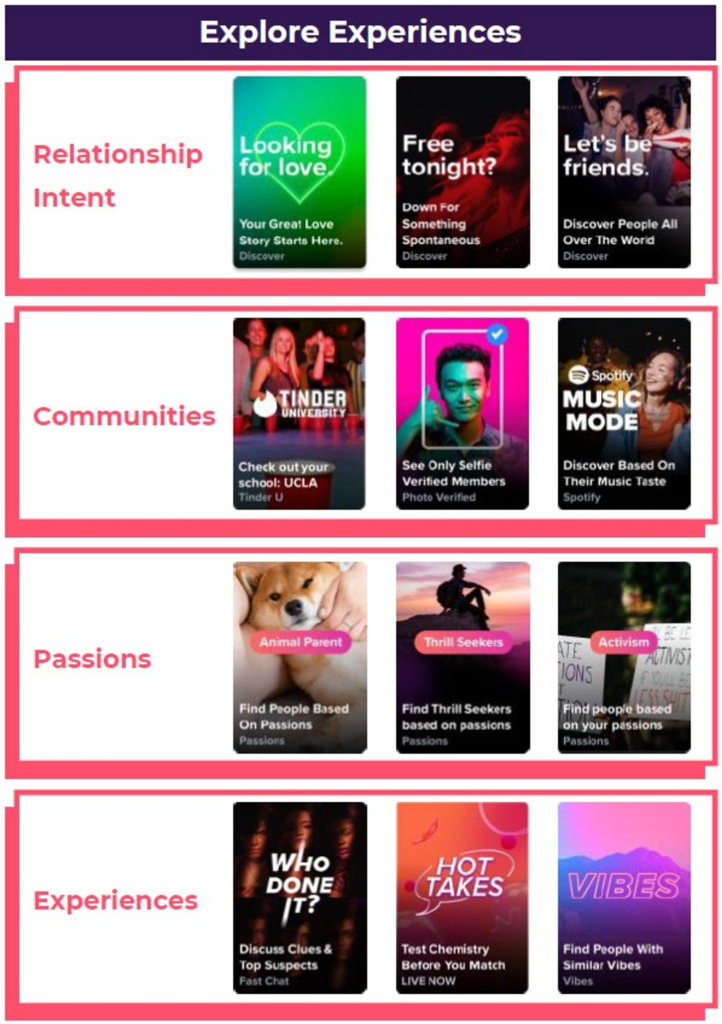
In short, dating apps have failed to compete with other social graphs on their own terms and IRL friend graphs don’t appear to bring meaningful advantages to online dating. This doesn’t mean certain social media mechanics can’t be carried over to dating apps. Tinder’s “Explore” tab, where users are organized by shared interests and relationship intent, seemed like a reasonable idea: a low risk way to efficiently sort matches on an app where users typically don’t provide any profile information beyond photos. But it was designed in the spirit of casual virtual hangs and hasn’t made any lasting impact on Tinder’s flagging user growth.
Dating apps are a utility. Where they go wrong is in positioning themselves as social hubs rather than as tools that take the burden off tired swipe thumbs. The functional orientation of dating apps is reflected in the way they monetize. Facebook is concerned with remaining relevant to younger audiences only in the sense that engagement drives ad revenue, so they’d rather have more of it than less. They aren’t thinking about demographic mix through a zero sum lens. Because Meta can personalize what it injects into a user’s feed, it is the amount of relevant content that matters, not the relative mix of men vs. women or young vs. old on the platform per se. So the two-sided network effects of social media are instantiated as engaged users on one side and advertisers on the other.
By contrast, the two-sided network effects in dating apps are expressed within the user base itself. The vast majority of revenue that any dating app realizes comes from men, who outnumber women by ~2x-3x1[2] and pay in order to improve their odds of securing dates with them. While engagement matters, where that engagement comes from is just as important. Dating apps try so hard to create compelling experiences for women for the same reason that bars offer them free drinks and bouncers block you and your boys even as they wave in a large bachelorette party. Single men will swipe right on just about anyone. There is no need to cater to them. If anything, barriers are required to keep them from upsetting the gender balance too much and bumming out women, who are not only fewer in number but tend to be far more parsimonious with right-swipes besides.
Tinder popularized a number of features that catalyzed its explosive rise just as smartphone adoption was taking off. Sparse profiles requiring nothing but photos made it easy to onboard. A freemium revenue model made it easy to trial. The “swipe” was suited to casually filling interstices of time throughout the day. But just as critical to Tinder’s success was the double opt-in feature, where both parties had to swipe right on each other before private messaging could commence, a feature that helped dam the deluge of unwanted messages from random guys, which was a big problem for women on Gen 1 desktop dating sites like Match.com[3] and OkCupid (though this continues to be a major issue, with ~2/3 of women under 50 on dating apps experiencing harassment[4] in one form or another).
So with online dating, we have a setup where men, fueled by the dopamine release triggered by the variable rewards that come from the unpredictable timing of matches, compete with one another for the prize of securing dates with a scarce supply of women. This looks an awful lot like gaming. In this Time article[5] from 2014, Tinder’s co-founder Sean Rad explains “We always saw Tinder, the interface, as a game….What you’re doing, the motion, the reaction.” You might even hypothesize that gaming is an outgrowth of the same competitive instinct, honed through evolutionary pressure, required to win mates. It then seems natural that Match’s latest CEO, Bernard Kim, spent 6 years at Zynga and close to a decade at Electronic Arts, and that before Bernard came on board, Match was replicating monetization dynamics pioneered by online gaming.
There was a time when online games made money through a “play to win” model where players had to purchase expansion packs and fancy gear to stand a realistic shot of advancing. But buying your way to victory seemed unfair and today most monetize through a combination of advertising and cosmetic in-game purchases that enhance a player’s experience without improving their chances of winning. Advertising never took hold in online dating. It’s a tiny part of Tinder’s revenue. I guess there’s not much data to target against. On the other hand, a la carte (”in app”) products are a meaningful source of revenue for Tinder, comprising ~25%-30% of its total. But unlike skins purchased in an online game, Boosts (which allows you to be one of the top profiles in your area for 30 minutes) and Super Likes (a blue star you can tap on someone’s profile that lets the other person know you really like them and prioritizes your profile on their card stack) in Tinder are purely functional.
The most enduring gaming franchises have avoided the hit driven paradigm that used to characterize the space by fostering communities. A gamer can earn status in those communities by procuring badges with skilled play or even by purchasing expensive skins that signal commitment or whatever. Dating apps aren’t like that. These are utilities, not communities. There is no signaling value or bragging rights to securing dates. The rewards from doing so are private. And I’ve got to imagine that spending boatloads of real money on Tinder Coins that you use to acquire virtual collectibles and buy your way to the top of card stacks could backfire? You don’t want to appear desperate or mark yourself as someone who takes online dating too seriously. That’s a turn off for women. There’s a reason your subscription status isn’t displayed on your Tinder profile and I can imagine that Boosts and Super Likes might dilute your prospects if women know you purchased them. I suppose part of the reason everyone on Tinder has a quota of Super Likes, regardless of whether they buy them or not, is so it’s not obvious to someone who receives one that the sender paid for it.
The analogy to gaming breaks down in a more fundamental and obvious way. There are no skills to master. Interesting photos that highlight facets of your personality can move the needle a bit, but whether you are right-swiped or not is primarily a function of your physical attractiveness relative to that of the swiper. In real life, where there are opportunities to flex other assets besides looks – intelligence, sense of humor, kindness, social status – over a sustained period, whether that be at school, with friends, or in the workplace, you will find plenty of couples who are mismatched on attractiveness. But in raw stranger-to-stranger encounters, particularly on Tinder where pictures are pretty much all you have to go on, physical appearance will be the dominant filter.
It used to be that Tinder assigned you a desirability score based on the mix of right and left swipes you received relative the scores of users swiping you, among many other factors. Users with similar scores made their way to each others’ card decks. Eventually, as Tinder scaled and accrued more user data, that competitive ranking system gave way to one where users in your card stack are similar to those who were right-swiped by people who tend to right-swipe the same profiles as you, which is apparently how Hinge matches users[6] too. In either case, though, you more or less end up in a matching pool with people who are comparably desirable. And that’s a good thing. If you’re a 2 in the looks department, you do not want a card stack of Margot Robbie’s. You may think you do, but you don’t. You may as well spend your time rating photos on “Hot or Not” because you will almost never get right-swiped. Online dating is nice in that it conveniently introduces you to mates while removing the embarrassment of in-person rejection. It also creates a rather efficient market that kills the dream a little for everyone.
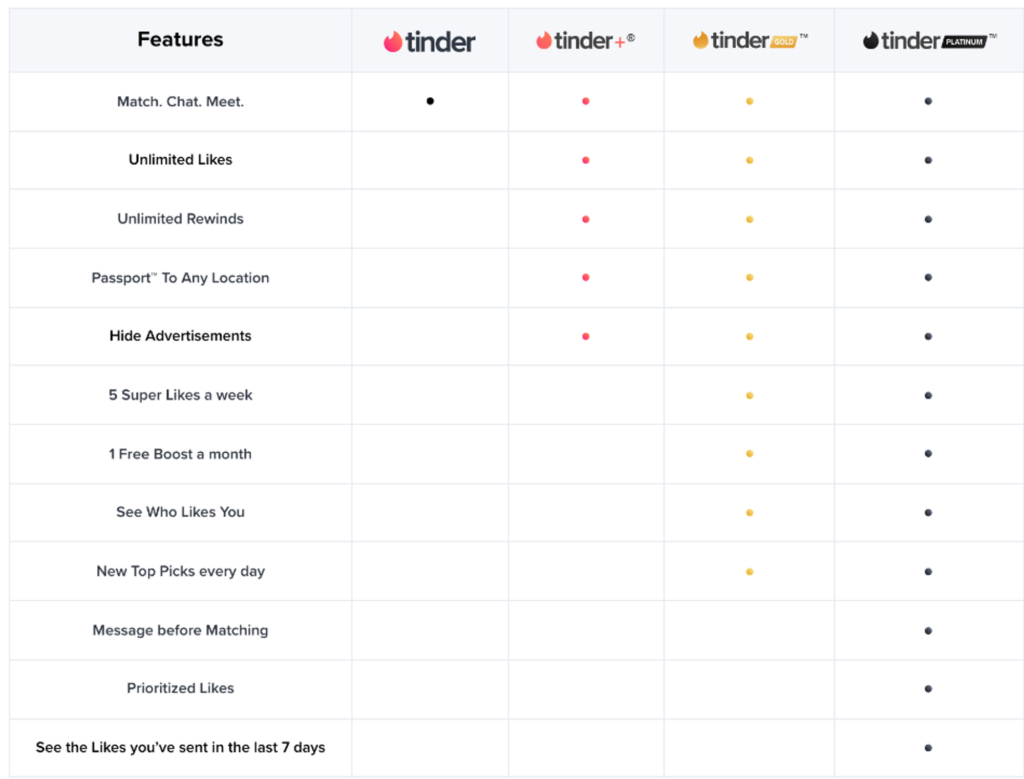
Within algorithmically determined matching constraints, Tinder is still monetizing off similar “pay to play” tactics that gaming companies abandoned due to the deleterious effects on the broader ecosystem. The analogy here isn’t great, as ~3/4 of Tinder’s revenue comes from subscriptions, whose benefits include things like “unlimited rewinds”, “see who likes you”, “passport” (where you can match with users in other cities), and “hide ads” that shouldn’t degrade the experience for other users:
But Super Likes, Boosts, and Unlimited Swipes – which are bundled into subscriptions, with Superlikes and Boosts available as a la carte purchases to boot – crowd out consideration for non-paying users and disrupt the match order that Tinder’s algorithm might otherwise find optimal.
Of course, social media also wrestles with an inherent tension between monetization and user experience. But compared to Instagram, which has as many ways to keep users engaged as there are varieties of entertaining content (not to mention, a relevant ad can be as compelling as organic content), a dating app has far fewer moves on a far smaller surface area. There are this many singles in a 10-20 mile radius and the job is to match those singles as efficiently as possible. That’s pretty much it. The post-matching experience is unpredictable and entirely outside Tinder’s control. There is no date rating system. You can understand why Tinder and others were tempted by metaverse experiences. And monetization is confined to short-term subscriptions and boosts because users don’t expect to spend a year or even months on a dating app, even if they ultimately do. This goes hand in hand with the classic tension of online dating as a business. The better the service is, the sooner you’ll be off it, and so subscribing on an annual basis feels like paying more for a worse product. That’s why “churn”, while almost certainly through the roof, isn’t relevant in the way we traditionally think about it. Even Tinder subscriptions feel less like subscriptions than they do product sales.
The other challenge is that while match liquidity begot by network effects is the governing moat for a dating app, it doesn’t lead to winner take all outcomes as there are many vectors along which network effects can be spun. While Tinder may be the largest dating app on the market, with 8x as many payers as Hinge and 4x as many as Bumble, it co-exists alongside a very long tail that encompasses a wide variety of apps catering to different races, religions, sexual orientations, and sensibilities. Even mainstream competitors like Hinge and Bumble successfully counter-positioned against Tinder by emphasizing serious relationships. Hinge (”designed to be deleted”) requires responses to prompts and demands 5 times the 3-4 minutes it takes to sign up for Tinder. Bumble is like Hinge but with strong brand messaging around women’s safety and empowerment that is reinforced by product mechanics (women are required to send the first message).
Dating apps inspire no brand loyalty. They aren’t held together by friend or interest graphs that keep users from experimenting with competing apps. People will typically multi-home across 3 or 4 apps at once, re-creating network liquidity across them to some degree. Features like voice texts, video, badges signaling seriousness of intent are easily replicable. All this has created the conditions for an unstable industry structure, with market shares radically shifting every few years, as chronicled in this video[8] from Data is Beautiful.
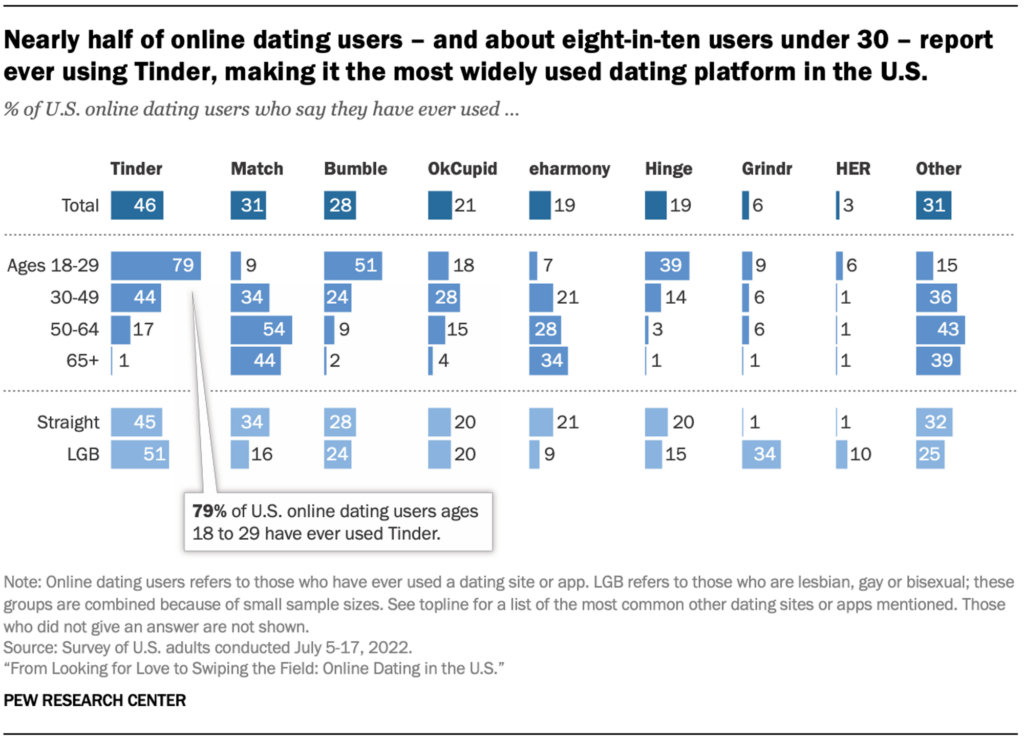
Since it was incubated within IAC in 2012, Tinder has gone on to become the most popular global dating platform, with around 75mn monthly active users (to put this in perspective, in the year of the iPhone’s debut, the largest dating site, Plenty of Fish, had about 8mn MAUs). According to Pew Research, 46% of US online dating users, including 79% of those between the ages of 18 and 29, report having used Tinder at some point:
But like so many apps before it, Tinder too is now wrestling with stagnant user growth. They are trying to combat this headwind by appealing to Gen Z users and women who might otherwise be drawn to more substantive connections on Hinge and Bumble, with marketing campaigns that de-emphasize its reputation as a casual hook-up app. But brand marketing that tells users what you hope to be known for will not work if the product is still grounded in low-friction onboarding and shallow swipes, and altering the core product or requiring users to invest more time on profiles upfront risks alienating existing users and further constricting top-of-funnel growth.
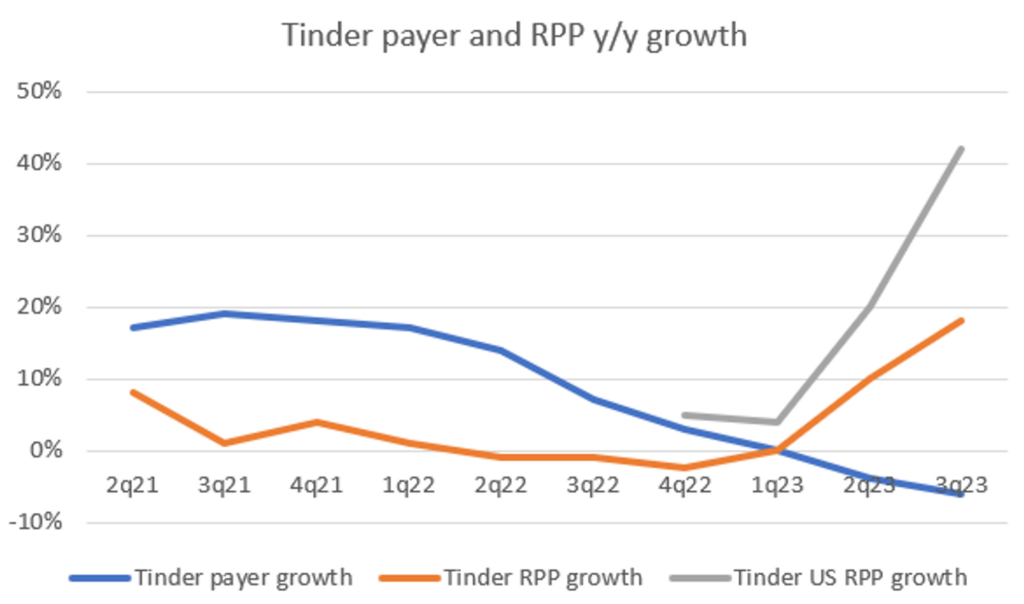
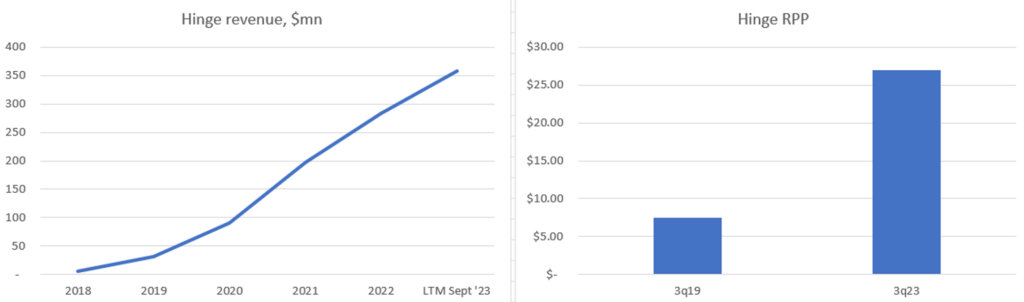
With a series of CEOs and product managers arriving with a plan to revitalize what they correctly recognized as a stale user experience and then resigning after failing to do so, it’s hard to escape the feeling that Tinder may just be out of moves when it comes to user growth, that Match’s most significant cash cow is now in senescence, following the all too familiar path of every other dating app that exploded in popularity only to slip into irrelevance. Management has long talked about optimizing for revenue rather than either payers or revenue-per-payer per month (RPP). Even so, bears will point to the mix of revenue growth increasingly coming from RPP at the expense of payers as evidence that top-of-funnel expansion and payer conversion have gotten much harder to come by. They will say that Tinder has matured to point where a greater mix of revenue growth must now come from extracting more value from the payers it already has.
A salient example of this is Tinder Select, a $500/month membership tier that was rolled out to the most active 1% of users in September. By now, we’re all familiar with the extreme tail in mobile monetization. In gaming, a small fraction of users will spend boatloads on cosmetic features for status and social connectedness. The top 1% accounts for half a publisher’s revenue or whatever. But I’m not sure think Tinder is amenable to nearly the extreme monetization tails you see in gaming. There are no status awards to win, no community to impress, and limits on how much Tinder can improve your matching prospects or date experiences. And if Tinder Select is that good at matching you with the right mate, well, you’re not going to be paying for very long. From an avid payer base of ~104k (1% of 10.4mn total payers), how many actually go for this and over what stretch of time? Do you get to, say, $50mn (5% of LTM EBITDA) by assuming 10k members at $500/month for 10 months? 20k members at $500/month for 5? My intuitions fail me here.
The concern is not that the online dating market is tapped out but that the subset of users drawn to casual swipe mechanics largely is, and management’s range of motion is constrained by the casual, low friction on boarding that made Tinder such a viral sensation in the first place. Over the years, they’ve introduced all sorts of initiatives (Swipe Night[9], Explore, Hot Takes[10], Vibes[11], video chat, the “Starts with a Swipe[12]” marketing campaign) whose impact on engagement, while promising at first, ultimately proved ephemeral. Tinder can play around with different monetization tactics on a given set of product features, but this only goes so far. At some point they’ll need to find durable, product-led ways to expand the efficient frontier, improving match quality and swipe efficiency across the board, expanding the top-of-funnel by appealing to Gen Z users, and attracting more women so payers can enjoy higher hit rates without unduly damaging the experience for non-paying users. They’ve announced a few so-so sounding things, like quizzes and prompts designed to add texture to profiles and more curated profiles for women, but I’m not sure why these rollouts should work when so many others like it have failed.
I’ve viewed Match’s prospects through a pessimistic lens thus far. But the company has several things going for it too.
First, while historically even once leading online dating sites abruptly lost significant share in a matter of years, that share loss occurred in the context of a rapidly expanding market. Share loss does not necessarily imply an imploding user base (consider that between 2014 and 2019, Tinder lost several points of market share even as its MAUs grew 44%2[13]). Match Group consolidates its atrophying legacy brands (namely, Match, Meetic, OkCupid, and Plenty of Fish) and its nascent ones (namely, BLK, Chispa, and The League) in a single segment (”Emerging & Evergreen”) that is declining low-single digits. Its non-Tinder revenue in 2016 – which basically reflects all the old stuff, including a full year of Plenty of Fish – was about $950mn. Based on management’s limited disclosures, it looks like those brands did around ~$650mn in 2022 and maybe ~$590mn this year, implying ~6%-7% annual contraction over the last 7 years. So while Match’s musty brands have declined, they’ve done so at a more measured pace than one might think, especially considering that, as desktop native apps, they were on the wrong side of a generational platform shift. I don’t want to minimize the structural challenges. Those legacy properties saw revenue declines accelerate to 11% over the last 2 years. I only mean to point out that just because a dating app fades out of conversation does not mean it step-functions to zero.
It’s also worth setting aside historical comparisons to just consider whether it would even make sense to launch a new mainstream dating app today. How would you do it? Tinder found product-market fit with swipes in 2012. Hinge was founded at about the same time, Bumble just a few years later, both counter-positioning against Tinder with serious relationship intent. There are and will continue to be countless niche dating apps but I feel like Tinder, Hinge, and Bumble pretty much have the mainstream segment covered. I’m not sure what new product innovation you’d launch from scratch today on mobile that hasn’t already been tried to draw the marginal user away from the liquid networks spun up by those established brands. That all three are all successfully pushing price testifies to the absence of viable alternatives.
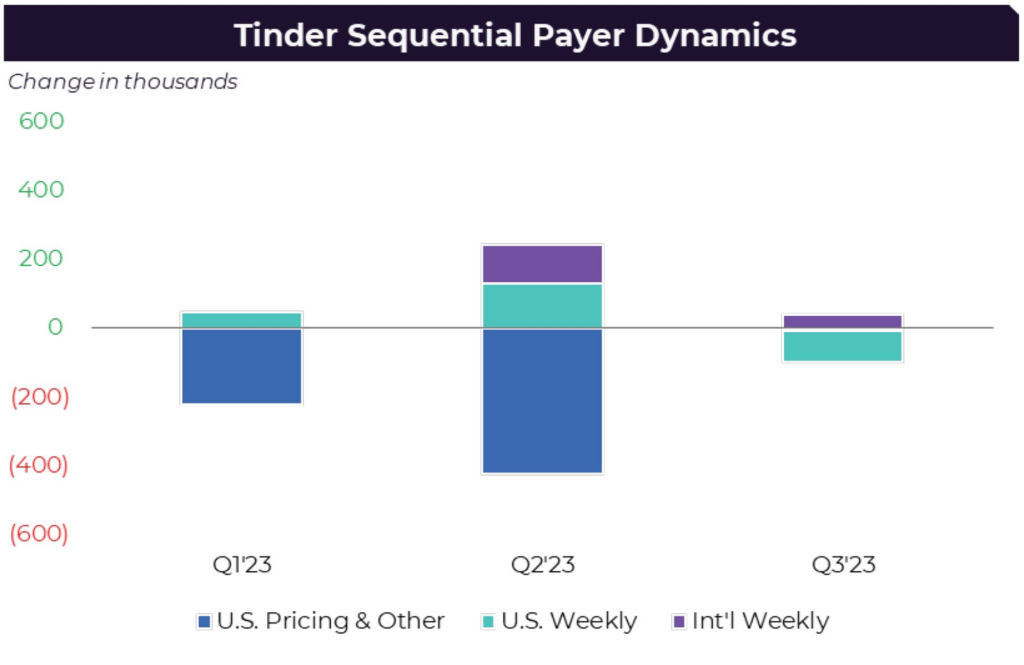
Second, while bears will interpret Tinder’s emphasis on RPP gains at the expense of payer growth as evidence that Tinder has saturated its market and is now resorting to value extraction, a more charitable interpretation – the one management obviously encourages analysts to take – is that Tinder’s past payer count was inflated by sub-optimal monetization. With aggressive pricing having now shaken out the weak hands, Tinder is building off a somewhat lower, reset base and can deliver a more even contribution from payers and RPP going forward. There is some early evidence of this, with payer losses attributable to US price hikes dissipating in 3q23, even with RPP growing by 8% q/q.
In 2q23 management launched weekly subscriptions in the US, which had the predictable impact of immediately juicing payer numbers, some of whom then churned off. But those declines should also settle over the next few quarters. We’ll see!
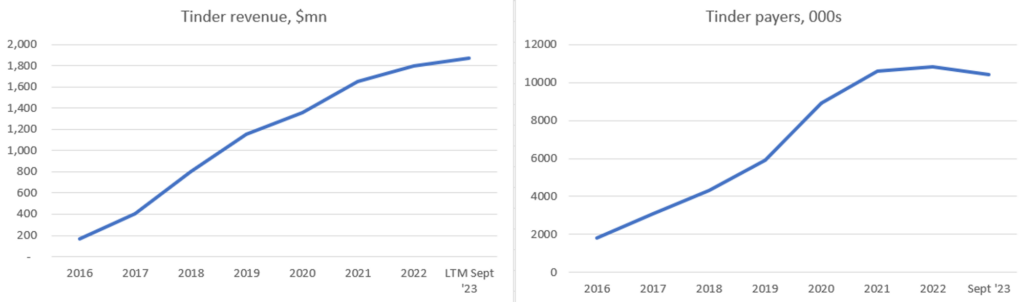
Third, to some extent Tinder’s durability is born out by the instability of its management. Tinder is now on its 6th CEO since 2015, Match Group is on its 4th. Various product managers and marketing officers have come and gone along the way. Former employees consistently complain about abrupt shifts in product strategy brought about by crazy turnover in the executive ranks. And yet, amidst that chaos, Tinder has 11x’ed revenue and 6x’ed payers.
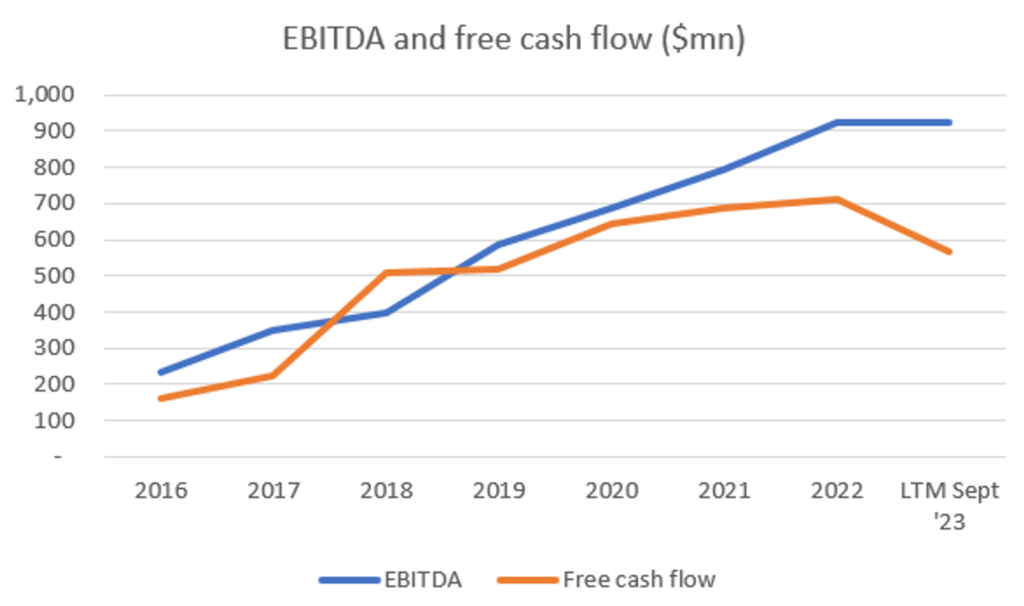
On the back of Tinder’s vertiginous rise and with Hinge following in Tinder’s wake, Match Group’s EBITDA and free cash flow (including stock-based compensation and excluding a significant litigation settlement in 2022) have grown by 22% and 20% per year, respectively.
So on the one hand, you could characterize Match as a directionless company plagued by years of inconsistent product direction and mismanagement. On the other hand, what better demonstration of product-market fit than Tinder sextupling payers despite said mismanagement, to say nothing of the stunning traction at Hinge? Match and Tinder’s current CEO, Bernard Kim, has been in place for almost 18 months. It has yet to be seen whether this ex-gaming executive proves a good fit for a dating app. But so far he’s made what I think are sensible moves in retiring Tinder Coins, swearing off big-ticket M&A, dropping the metaverse blatherskite pushed by his predecessor, and pursuing less radical blocking and tackling maneuvers around monetization and product experience.
Fourth, Hinge is one of the fastest growing mainstream dating apps on the market and Match owns it. They paid somewhere around $25mn in 2018 for an asset whose revenue is today run-rating at $400mn, having grown by 43% from a year ago.
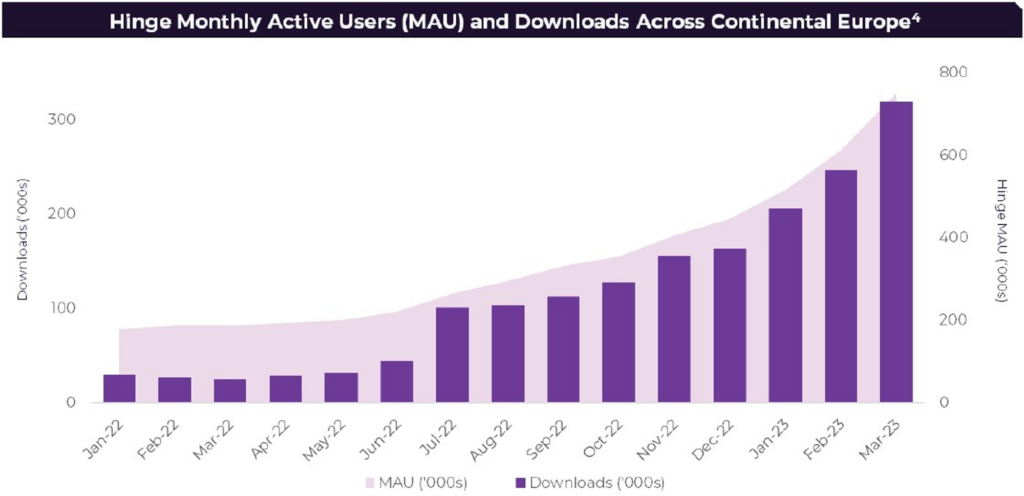
In the 5 years since Match acquired a majority stake, Hinge has gone from the 13th most downloaded app in the US to the 3rd[14]3[15]. It has exploded in popularity across continental Europe – its download rank improving from #21 to #3 from May ‘22 to Mar ‘23 in Germany and surging to #2 in France, behind Tinder, just 3 months after launch – and is among the top 3 most downloaded dating apps in 14 countries.
Hinge caters to those with serious relationship intent and demands more time of users upfront, so I doubt its user base will ever catch up to Tinder’s. But by virtue of drawing serious daters, Hinge should have more pricing power. I estimate Tinder’s US RPP to be ~$26, implying that Hinge, which does $27 from a user base heavily concentrated in rich Western countries, probably has a lot more room to grow (by comparison, The League, another dating app owned by Match Group, which admits members based on social status, educational attainment, and professional accomplishments, does more than $100).
Hinge’s unexpected success segues to another key point. While Tinder is by far its most significant banner, it is buttressed by a long tail of apps in Match’s portfolio, each catering to a different user base – snobs (The League), African Americans (BLK), Latinos (Chispa), Christians (Upward), single parents (Stir), serious daters (Hinge), gay men (Archer). Within the mainstream apps, there is even a plausible “lifecycle” narrative where users engage most on Tinder in their early-20s, then age into more “serious” apps like Hinge and Bumble in the late-20s and early-30s. Alongside those are apps targeting Asian markets (Pairs, Hakuna, Azar) and old school properties like match[3].com, Plenty Of Fish, and OkCupid that are being gracefully harvested for cash. Most of these properties will amount to nothing, but it’s hard to say which ones. Success in online dating business is hard to predict. Match spent $575mn on Plenty of Fish, which ultimately went nowhere, and $25mn for Hinge, which has become a top 3 dating app by revenue.
But thinking of Match Group as a portfolio of call options with random, binary outcomes is probably too simplistic. Despite chaos in the executive ranks, the company seems to have a knack for profitably growing brands. Match.com[3] was for years the leading dating site in desktop. Tinder was incubated at IAC and grew to become the dominant dating app globally under Match’s ownership. Hinge did just $5mn in revenue the year it was acquired by Match and now, less than 5 years later, is run-rating at $400mn. Archer was built in-house and is close to rivaling Grinder’s US weekly downloads just months after its limited rollout.
A skeptic might retort that we don’t know the counterfactual, that Match is just riding the wave of colossal success that these banners would have experienced as standalone companies anyways. Fair! While there are some lesson and tactics shared across them, Match’s properties generally operate independent of one another (their flagship apps have different code bases and even different headquarters), which stokes the perennial concern that another app could launch out of left field today and steal Tinder’s users. But again, the highest-revenue generating dating apps in the US today (as far as I know) – Tinder, Hinge, Bumble, Grinder – were all founded more than 10 years ago, in the early days of smartphones. As long as mobile remains the dominant platform, it’s hard to see a startup introducing a novel angle of attack that siphons users away (AI girlfriends maybe?).
Given that dynamic, the natural exit strategy for a pre-revenue dating app that is starting to gain traction in some niche is to sell to Match. Even if you are of the opinion that Match isn’t operationally responsible for the success of its apps, they’ve at least put resources behind the right ones. Consider that, what, hundreds of US dating apps have launched since the mid-‘90s? Is it just coincidence, having nothing to do with resource allocation or execution, that 2 of the 4 highest monetizing ones in the US happen to be part of the ~45 that Match owns? Maybe, but I doubt it.
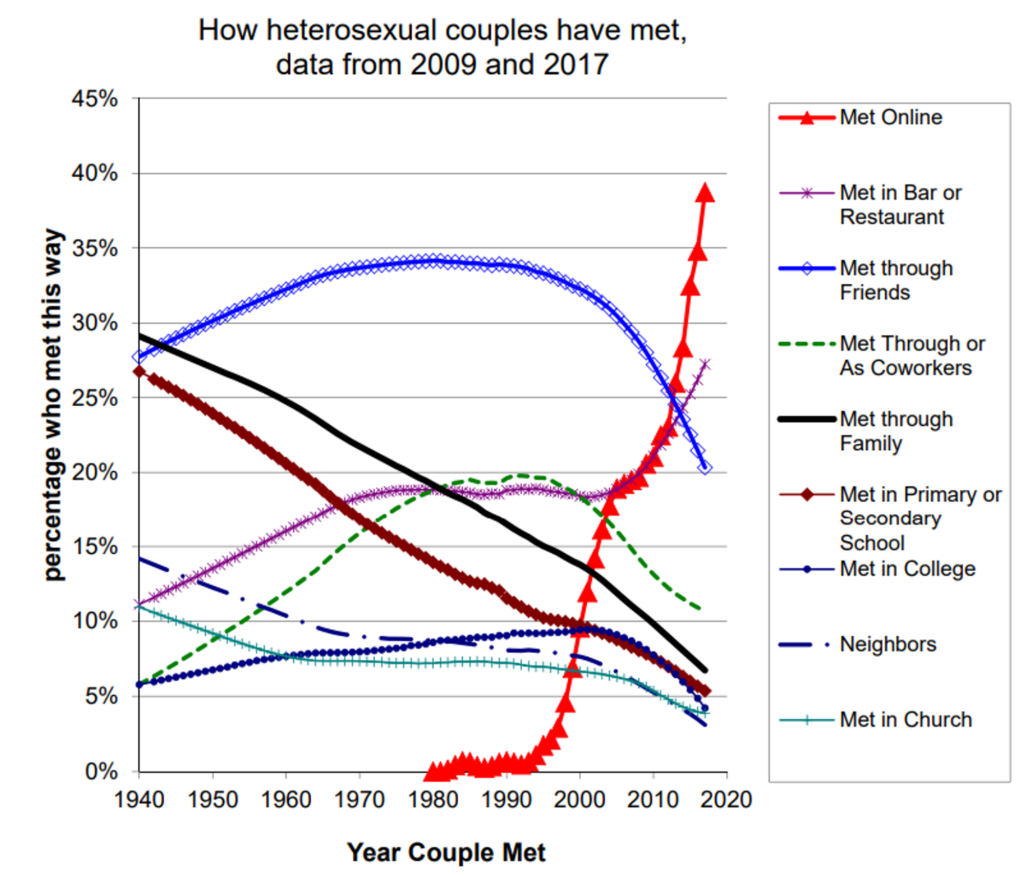
Match Group is for now a bet on Tinder. But as a vehicle of diverse apps catering to a broad swath of niches, managed by a group with a strong track record of acquiring and profitably nurturing the industry leaders, it is also a bet on the online dating category as a whole. I think you can feel good about the latter. In the Western world, the cultural taboos around online dating have more or less fallen away. By 2017, more heterosexual couples in the US met online than through any other channel, with a new S-curve for online dating forming at around the time smartphones took off.
Source: Disintermediating your friends[16]: How Online Dating in the United States displaces other ways of meeting (Michael Rosenfeld, Stanford University, 2019)
In the Middle East and Asia, online dating is far more stigmatized (in Japan, for instance, Tinder users will commonly post pictures of flowers and landscapes instead of their faces) and monetizes at lower rates to boot. But even if adoption is never as widespread there as in the US, I suspect it will continue to trend the same way.
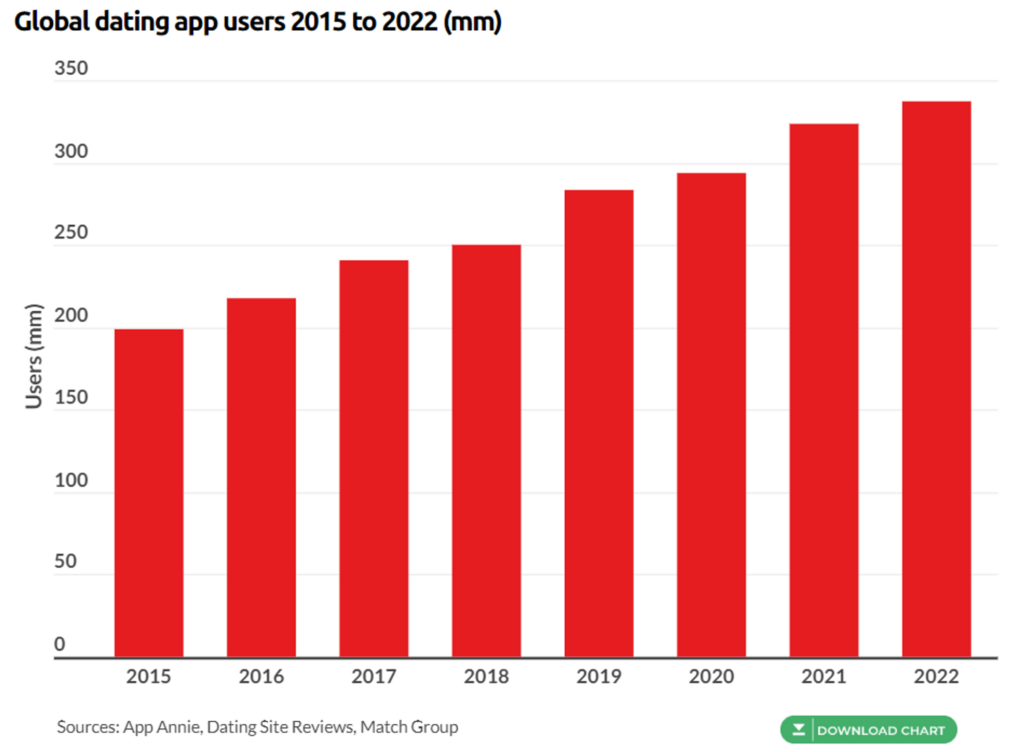
The number of dating app users globally grew by ~8% a year from 2015 to 2022 and I see no reason why growth should meaningfully slow.
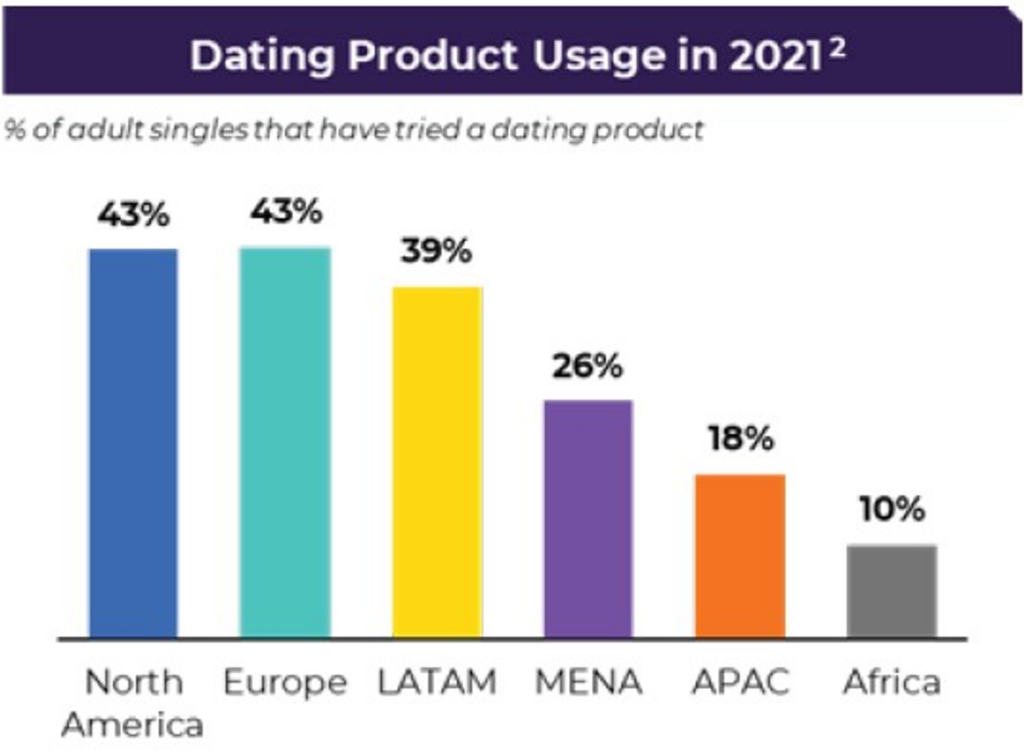
Even in “mature” markets like North America and Europe, 57% of adult singles have yet to try a dating product.
Source: Match Group (1q22 shareholder letter)
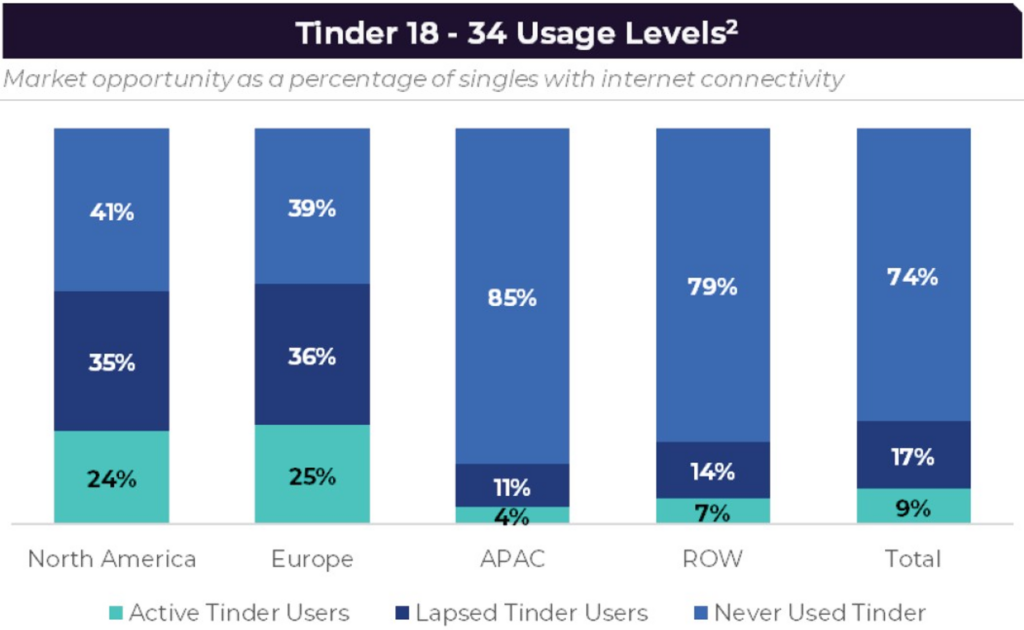
In theory, Tinder also has room to grow, with only 24% of single 18-34 year-olds counting themselves active users. Another 35% are lapsed users and another 41% have never used Tinder at all.
Source: Match Group (8/2/22 investor letter). 2021 surveys and research. Percent of respondents that have ever used a dating app or site (single, and not in a relationship), excluding China.
All dating platforms must contend with success translating into users pairing off and leaving the platform. But this headwind is offset by new, larger cohorts of 18-year old’s who are going to be pulled to the most liquid network like the cohort before them, and lapsed users who reactivate their accounts when those relationships don’t work out.
In summary, Match Group is a vivarium of dating sites targeting a broad swath of interests and demographics. Its marquee brand, Tinder, is showing signs of user stagnation, but revenue growth has accelerated from 4% to 10% over the last 2 quarters on the back of significant price hikes and the introduction of weekly subscriptions, a rate of growth that it expects to maintain next year. Payer declines are moderating as users adjust to the changes, with management expecting a return to sequential growth by the middle of next year. Whether they can pull this off, let alone return to mid/high-single digit growth will depend on top-of-funnel growth, which they are trying to improve with product and marketing initiatives. I think they’re in a tough spot here for reasons I discussed. Hinge, meanwhile, is on fire. Last quarter they grew payers by 33% even as RPP advanced 8%. With just half the number of payers as Bumble and RPP at US Tinder levels, I suspect there is lots of runway for both metrics.
The msd revenue declines at Evergreen and Emerging (22% of revenue) should moderate somewhat as the segment continues to mix toward the fast growing Emerging concepts, which growing 40%-50% a year, partially offsetting the declines of legacy banners. Match Group Asia (9% of revenue) has reversed its y/y contraction and is now growing low-single digits as Azar, 2/3 of Hyperconnect’s revenue, is now growing 20%/year on the back of “AI-enabled” algorithmic matching (whatever that means), offsetting the continued weakness at Pairs (the largest dating app in Japan) and Hakuna. Meanwhile, operating margins have expanded from flat at the time of acquisition to around 10%. While Hyperconnect did not live up to Match’s metaverse ambitions and management would probably take back the acquisition if they could, it brought some advanced technology that can be leveraged across Match’s other brands and it doesn’t hurt to own a platform that is tuned to the cultural sensitivities of what could prove the largest addressable region for online dating.
Finally, last year Match paid $623mn to app stores, a huge sum compared to its $965mn of EBITDA. I wouldn’t buy shares on the expectation of massive fee relief, but maybe keep this option in your back pocket for a rainy day.
All things considered, I can appreciate how many think the stock looks attractive here at 18x trailing free cash flow, 14x EBITDA. To put things in perspective, Match has around the same market cap and only 25% more enterprise value than it did at the end of 2017, when Tinder was doing just 1/5 the revenue and Hinge wasn’t even part of its complex. At 40x free cash flow it was arguably overvalued back then but at less than half that multiple today I think you can make a reasonable case that the stock has overshot to the downside. Assuming 8% growth at Tinder (0% payer growth / 8% RPP growth), 27% at Hinge (18% / 7%) growth, 3% at Match Group Asia, 15% contraction at established brands, and 25% growth from emerging ones, blends out to ~9% revenue growth over the next 5 years. With so much of that growth fueled by pricing at Tinder, we could see a doubling of EBITDA that drops down to ~$4.5 in per share cash earnings (including stock comp). At 15x-20x + accumulated cash, the stock compounds between ~19% and 25%.
At the same time, that’s all just playing with numbers. I can’t say I’ve got strong opinions one way or another about the extent of Match’s pricing power, its ability to drive user growth, the efficacy of its marketing initiatives or pending product refreshes or really anything! Hinge is often pitched as a “hidden” asset that will become more appreciated as it makes up a larger part of Match, but I’m not sure how much long-term signal we can confidently glean from current results. Fade rates can be much steeper than investors appreciate. Tinder was growing by more than 40% just 4 short years ago, about as fast as Hinge is growing today. But then again, singles need to go somewhere to find dates and where else if not Tinder, Hinge, or any one of the dozens of apps in Match’s complex?
Disclosure: none of the accounts I manage own shares of Match Group
IAC and MGM
Posted By
scuttleblurb
On
In
SAMPLE POSTS,[IAC] IAC,[MGM] MGM |
3 Comments
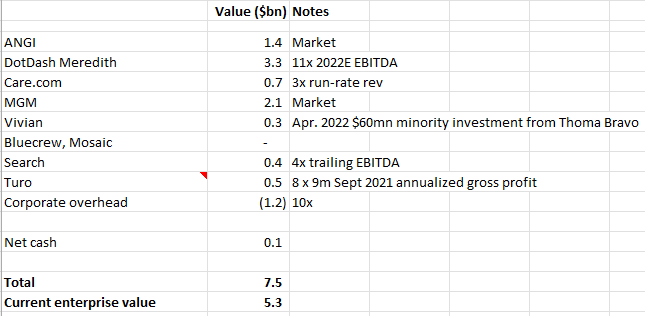
There was a time, not too long ago, when an investor could treat IAC as a collection of binary early stage bets anchored by a few more mature and profitable entities. To most, IAC’s 12% passive minority stake in MGM, acquired near the COVID lows, was a weird one-off opportunistic gambit that could be marked to market. The real diligence was saved for Angi’s, DotDash, and Vimeo. I don’t think many felt compelled to deep dive into casinos because like, whatever, the $1bn MGM investment comprised just ~9% of IAC’s market cap at the time and it felt like most of the upside was going to come from IAC’s digital assets, not a passive minority stake in a mature brick-and-mortar casino operator. Psych!! Now Angi’s is melting away as its fixed price offering, launched to great fanfare 2-3 years ago, struggles to find product-market fit. DotDash no longer expects to hit its $450mn EBITDA target next year given the weakness in brand advertising. Vimeo has lost ~90% of its market cap since being spun off last May, as losses have widened, growth has dramatically decelerated off tough COVID comps, and investors have soured on unprofitable growth concepts. Meanwhile, MGM shares have nearly doubled from the ~$17 price at which IAC first accumulated shares in 2q and 3q 2020. IAC has since added to its MGM stake, first at $45 and more recently in the low-$30s. With valuations in digital growth assets wrecked and its own stock price sliced in half, IAC could have opportunistically acquired another digital lottery ticket or more aggressively repurchased (more of) their own shares. But no. They increased exposure to MGM instead. Today, the $2.1bn MGM position accounts for 35% of IAC’s market cap, making it the second most valuable asset in the IAC complex after DotDash.
MGM is a set of cash flowing retail casino properties plus a call option on a nascent but potentially massive online sports betting and iGaming opportunity through its 50% ownership of BetMGM. Through its Las Vegas Strip (LVS) segment, MGM operates 9 casino resorts, with Aria4[17], Bellagio, MGM Grand, Mandalay Bay, and The Cosmopolitan the most notable and profitable among them. The Regional segment consists of 8 casinos, with The Borgata (Atlantic City, NJ), MGM Grand Detroit (Detroit, MI), and MGM National Harbor (Prince George’s County, MD) contributing more than 60% of Regional’s pre-COVID segment EBITDA.
Las Vegas has come a long way from the mob-run cesspool portrayed in the 1995 classic Casino. In his concluding monologue, Sam Rothstein, head of the (fictitious) Tangiers casino, laments:
The town will never be the same. After the Tangiers, the big corporations took it all over. Today it looks like Disneyland….After the Teamsters got knocked out of the box, the corporations tore down practically every one of the old casinos. And where did the money come from to rebuild the pyramids? Junk bonds.
Today’s Las Vegas is an entertainment destination, host to an NFL team, dozens of industry trade shows, megastar concerts, and Michelin Star Restaurants. Profits have migrated away from low and mid-tier casinos like Circus Circus and Westward Ho, toward properties that resemble luxury cities, with high end retail spaces, restaurants, and other posh amenities enveloping conference attendees, high rollers, and Asian tourists, a favorable development for MGM and Wynn, whose Vegas portfolios tilt fancy.
Regional properties are more for the dead-eyed locals. Atlantic City and certain high-end 100k+ square foot casinos like MGM’s Borgata and National Harbor have a regional “destination” feel to them I suppose, but there are hundreds of others – like the Ameristar and Hollywood branded locations run by Penn Entertainment or the Isle of Capri and Harrah’s casinos run by El Dorado (now Caesar’s) – that attract middle-income gambling-oriented clientele in a ~100 mile radius.
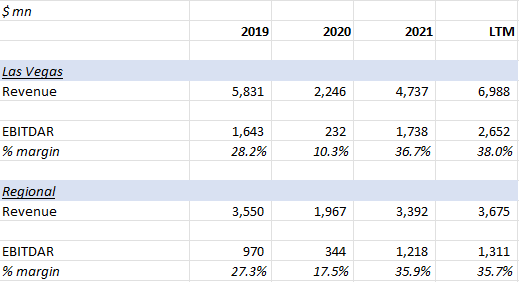
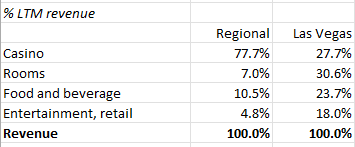
So while MGM’s LV segment gets nearly 3/4 of revenue from non-gaming sources – hotel rooms, food, beverage, entertainment, and retail – close to 80% of Regional revenue comes from gaming.
You’ll notice a similar disparity at Wynn and, to a lesser degree, at Caesar’s, which latter operates shabbier Vegas properties like Flamingo (will probably be sold soon), Bally’s, and Paris that don’t attract as much food and retail traffic.
The gaming industry has consolidated over time, with acquirers binding disparate casino properties together through loyalty programs, keep players engaged in an ecosystem. Through the MGM Rewards – the second largest gaming rewards program after Caesar’s, with ~35mn members – regional casinos can feed traffic to destination resorts, as the rewards earned by gambling at Beau Rivage can be redeemed for concerts or room discounts at the Bellagio or Aria.
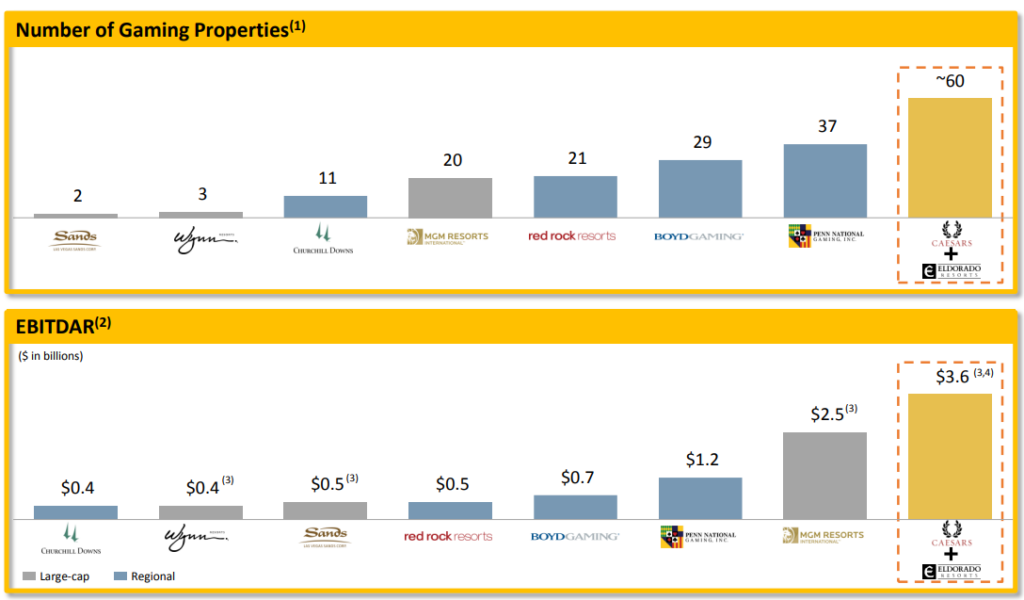
Here’s a pre-COVID summary of the top casino operators in the US:
Source: Caesar’s/El Dorado merger presentation
MGM is in the middle of the pack in terms of property count, but generates the most EBITDAR per property with 3 of the 5 most profitable Vegas assets, and commands leading ~50% share of the Vegas gaming market, which is in a much better state today than it was heading into the last recession. Back then, Vegas was flooded with supply, with MGM, in partnership with Dubai World, breaking ground on City Center, an 18mn square foot hotel-casino-retail-residential colossus5[18] whose development costs exploded from $4bn to $9bn just as the economy tipped into recession. Exacerbating matters, another luxury casino resort, The Cosmopolitan, opened its doors just a year later in 2010. Since then, with the exception of Resorts World last year, there haven’t been any notable capacity additions and by most accounts there won’t be for at least the next 5 to 10 years. The returns just aren’t as compelling as they used to be. The Bellagio, the most profitable casino in Vegas, generated ~$500mn of EBITDAR at its pre-COVID peak on a development base of just over $2bn. If Resorts World is any guide, a comparable property would cost more than twice as much to develop today.
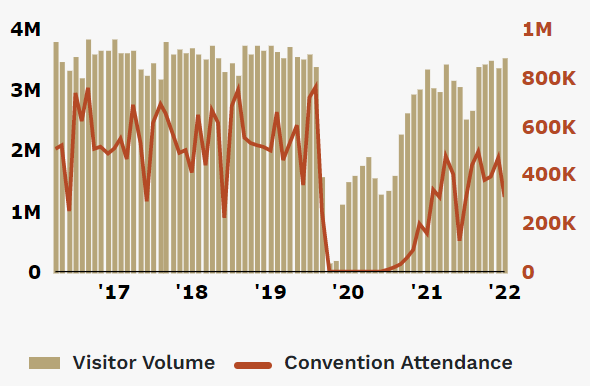
Following a brief COVID blip in 2020, Vegas is booming again. MGM’s LVS EBITDAR margins, at 38%, are 7-8 points above their pre-COVID peak on record revenue, even with cross-border travel restrictions deterring high-spending Asian gamblers and traffic from convention attendees, who are among the most profitable customers, ~1/3 below pre-COVID levels.
Source: Las Vegas Convention and Visitors Authority (link[19])
MGM isn’t alone. Caesar’s and Wynn have also reported record Vegas profits. Some of the margin gains are due to sustainable cost cutting and efficiency gains – things like self-service check-ins and the cessation of daytime entertainment and buffets and whatnot. But I think most of it can probably be attributed to temporary COVID spasms. Operators haven’t had to invest as much in promotions and marketing to lure pent-up demand and Average Daily Room rates are 36% above 2019 levels.
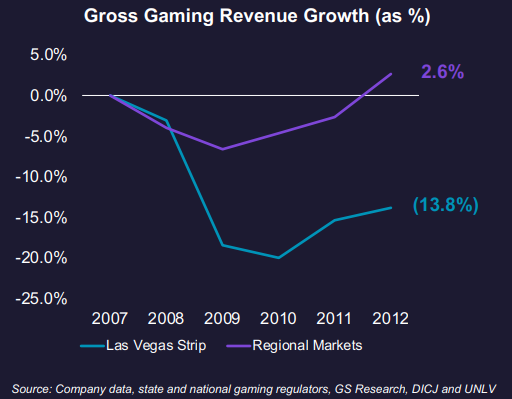
The Regional properties are also enjoying record margins but facing tough comps as locals apparently dumped their stimulus checks on slots and blackjack last year. But if the last recession was any guide, gaming revenue at regional properties tend to be relatively resilient.
Source: PENN Entertainment presentation (8/2/22)
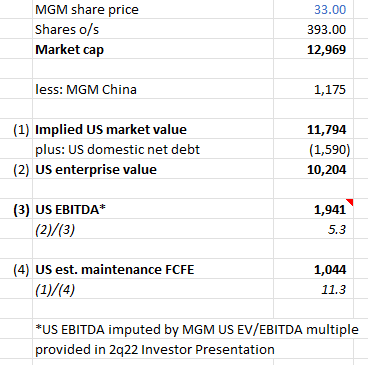
In addition to its US properties, MGM also owns a 56% stake in MGM China, which operates two casinos in Macau that derives ~80% of revenue from gaming. The Macau gaming market, once the world’s largest, has been decimated by draconian COVID restrictions that include occupancy limitations, temperature checks, quarantines for mainland Chinese residents. The Chinese and Hong Kong governments suspended group tour travel and ferry service. The consequences have been predictable. MGM China did -$66mn of EBITDAR over the last 12 months, down from $735mn in 2019. The Hong Kong listed stock has lost ~80% of its value since the start of 2018. With Macau and China lifting some restrictions in recent months, I’m inclined to think the worst has past. But even if I’m wrong MGM still looks pretty dang cheap:
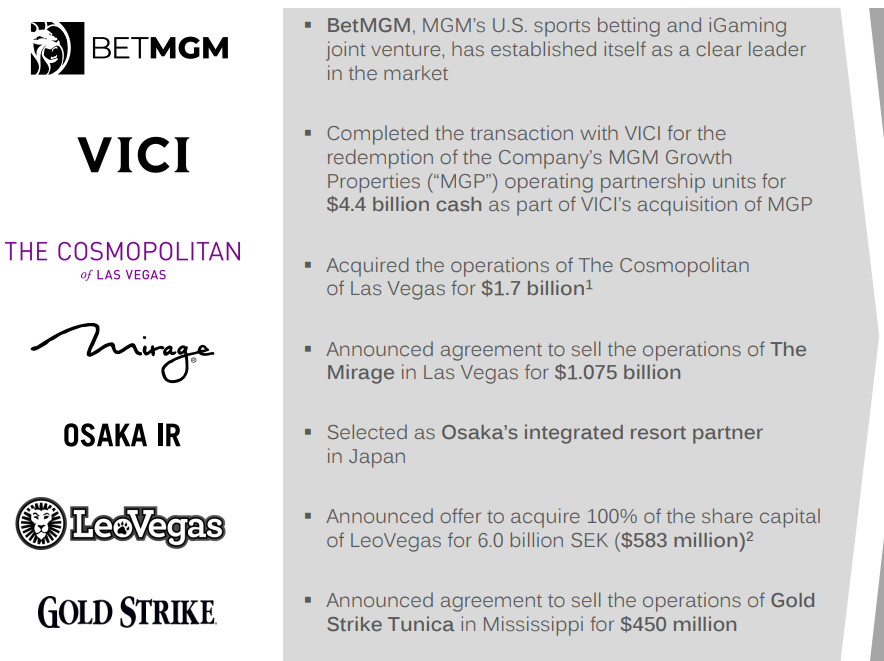
And I guess MGM’s management thinks so too as they’ve raised capital through a series of transactions (see below), including the sale of the operations of The Mirage and Gold Strike for 17x and 11x EBITDA, respectively, to retire 31% of its shares since early 2021 at ~5.5x EBITDA.
(the most significant source of cash has come from the sale of MGM’s operating partnership units of MGM Growth Properties (MGP) – an umbrella partnership REIT[20] that owned 7 of MGM’s LVS properties – to VICI Properties, another REIT formed in 2017 as part of Caesar’s bankruptcy restructuring, who is leasing back the properties to MGM. The real estate of MGM’s other 2 properties, Aria and Bellagio, is owned by Blackstone. Today, all of MGM’s domestic properties are owned by either VICI or Blackstone-affiliated entities. Sale-leasebacks have become a common way for casino operators to raise cash. El Dorado funded part of its $17bn merger with Caesar’s by selling casino real estate to VICI).
MGM’s profit margins are probably somewhat inflated and who knows if convention traffic ever reverts to pre-COVID levels. Compressing MGM’s property margins by 5 points and assuming no MGM China appreciation results in a valuation of 7.6x US EBITDA / 20x mFCF, which still seems reasonable for a collection of high-end casino resorts, bound together by a huge loyalty program, that gush cash as part of a consolidated industry structure. Admittedly, the US retail gaming industry is saturated, with few avenues for organic growth. But MGM has a few aces up its sleeve ;).
First, 15 years after it first actively explored development in Japan, MGM, together with its local JV partner ORIX, was finally selected by Osaka to build one of the country’s first integrated resorts. Several other US operators have tried to crack the Japanese market over the last 20 years, to no avail. Las Vegas Sands withdrew its bid in Osaka[21] to pursue development in Tokyo or Yokohama before pulling out of those cities as well in May 2020. Wynn also dropped out of Osaka in 2019 after a decade of “working on Japan quietly behind the scenes”6[22]. They claimed to be pursuing something in the Tokyo region, but haven’t followed up on this for years. Caesars withdrew from Japan following its merger with Eldorado, with Eldorado CEO Thomas Reeg cautioning analysts that they had “not made firm decisions on the international front”. But then soon after MGM won over Osaka, the company announced it was back in the game[23], working with Clairvest, former Las Vegas Sands executives, and a consortium of developers to build something in Wakayama.
Should the MGM-ORIX bid be approved by Japan’s central government sometime in the next few months, the consortium expects to break ground in late 2023 and open in 2029. This is a big deal. At an expected cost of $10bn, Osaka will quite possibly be the most expensive casino ever built. The project will likely be funded 50/50 between MGM and ORIX (or 40/40/20, with the 20% stub funded claimed by a yet-to-be-determined group of Japanese companies). Assuming its 50% share is 55% debt-funded, MGM will contribute around $2.25bn. I think the most expensive casino resort built so far in Asia is Wynn’s Marina Bay Sands (Singapore), which opened in 2010 at a cost of $5.8bn and did $1.7bn peak EBITDA on a $3bn revenue base. At 30% of gross gaming revenue (or “GGR”, amounts wagered minus amounts won by gamblers), Japan’s gaming tax rate is considerably higher than Singapore’s, which ranges between 8% and 22%[24]. So maybe on a $10bn investment, the Osaka mega-resort delivers something like ~$6bn of revenue and ~$2bn of EBITDA. At 8x EBITDA, MGM’s 50% stake is worth $8bn, the equity portion ~$5bn, translating into ~$1.2bn of incremental equity value when discounted back 8 years at 12% (compared to MGM’s present ex. MGM China market cap of $12bn).
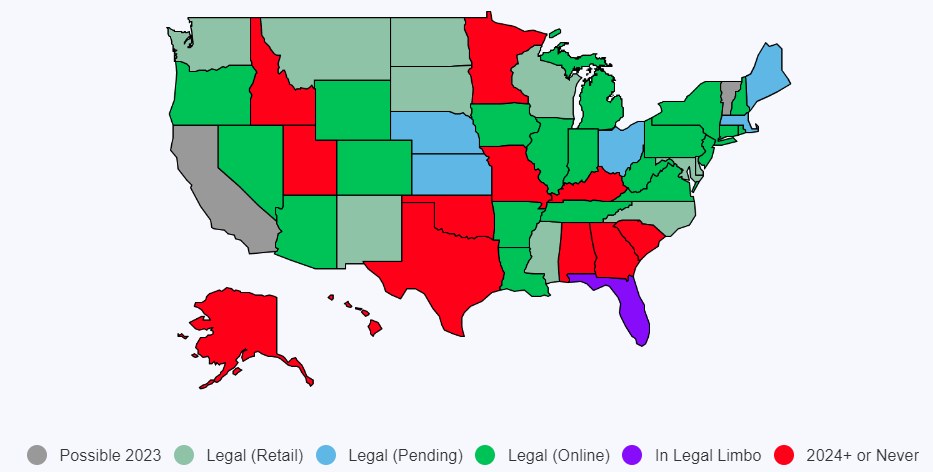
Possibly more significant is the latent value in MGM’s 50% ownership of BetMGM, an iGaming (online casino) and online sports betting joint venture with UK-based online gaming operator Entain7[25]. Since the Professional and Amateur Sports Protection Act (PASPA) of 1992, which prohibited online gaming activity in most states, was overturned by the Supreme Court in May 2018, online sports betting has been legalized in 25 states. To the degree that Daily Fantasy Sports, which is regulated in 43 states, is a leading indicator for OSB we may see more states follow suit.
Online sports betting is now accessible to ~44% of the US population. Should Proposition 27 pass in California this November – which seems probable given that 58% of Californians supported the ballot measure, as reported by BetMGM management in May – penetration will ratchet to ~56%. This should be particularly good for BetMGM as Vegas traffic and MGM Reward’s membership over-indexes to California.
Without the cultural entrenchment of sports, iGaming acceptance has been harder to come by, legalized in just 7 states8[27].
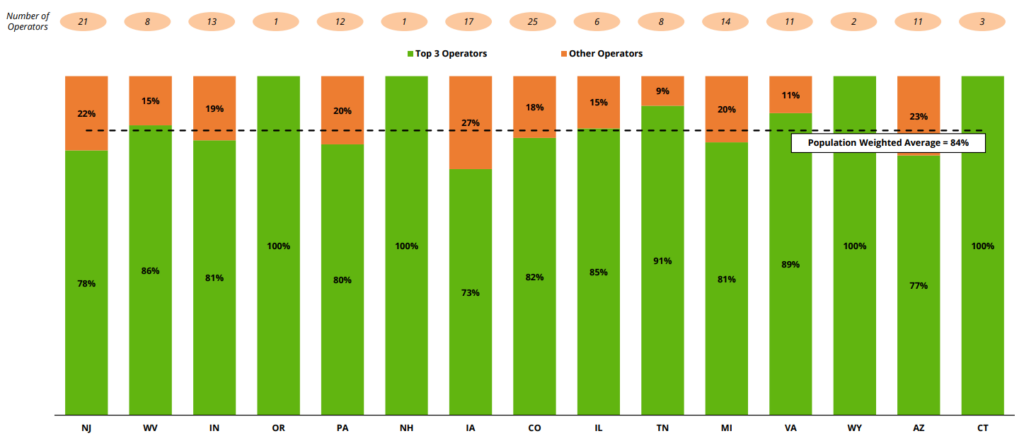
Wynn tried to offload its OSB/iGaming division last year to a SPAC run by Bill Foley (of Fidelity National fame), but the deal was called off months later. At the moment, Wynn Interactive is run-rating at just $80mn in revenue (compared to $1.6bn of LTM revenue at DraftKings and $1.3bn of expected 2022 revenue at BetMGM) and isn’t losing nearly enough money to make me believe management is taking things all that seriously. Caesars claims around low-teens share of national sports betting measured by handle (the $ amount of wagers placed) but MGM has some exhibits that suggest Caesars’ share is much lower by GGR. PENN Entertainment, with $547mn of LTM digital revenue and its insistence on responsible growth, hasn’t engaged in promotional land grabs to nearly the same degree as peers, generating -$17mn of cumulative EBITDA on $889mn of revenue since the start of 2019 compared to -$2.9bn of EBITDA on $3.1bn of revenue at DraftKings. There are a dozen others getting after it but by most accounts FanDuel, DraftKings, and BetMGM are so far the primary contenders, with ~75%-80% combined GGR share in OSB and 70%+ share across OSB and iGaming.
Here is Online Sports Betting GGR share by state:
Source: DraftKings Investor Day (March 2022)
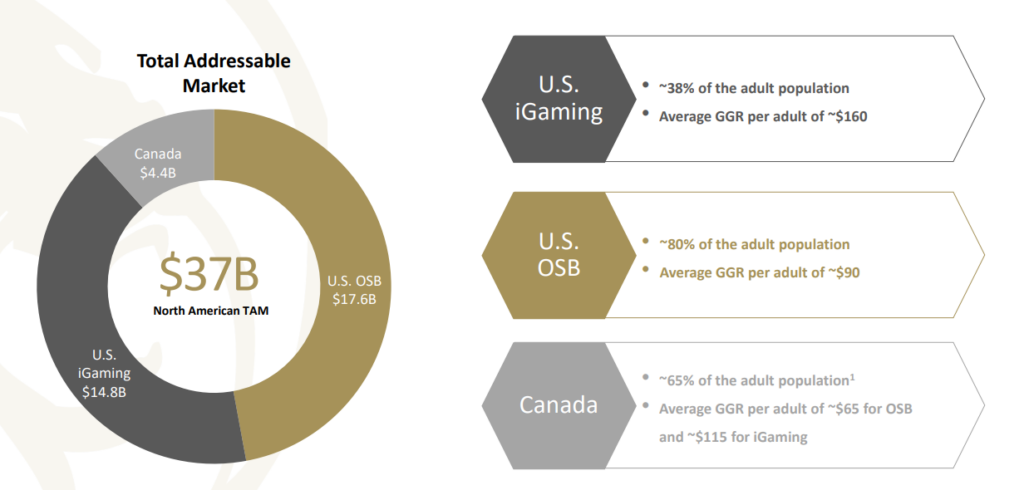
Just 4 years since PASPA was overturned, the $32bn addressable US market is fueling vertiginous growth for the leading participants. BetMGM is on pace to deliver $1.3bn of revenue this year, up from less than $200mn in 2020. FanDuel and Draftkings have likewise produced explosive triple digit annual growth.
Source: BetMGM
(DraftKings estimates $26bn of US TAM by applying the OSB and iGaming gross revenue per adult in New Jersey, the most mature online gaming market, to the US adult population and adjusting for differences in per capita GDP).
The growth is not without controversy. The primary bear case is that in their rush to grab share, online operators are spending exorbitant sums on marketing and promotions that can’t be justified by the lifetime value of acquired gamblers. This past January, my friend Andrew Walker called attention to the frenzy of promotions in the newly authorized New York market, observing in his article What the fudge is happening with NY sports betting promos[28]?
But I don’t understand how businesses can create positive value from the amount of free money that’s being given away. Consider Caesar’s, since they’re the outlier in terms of over quality. They’re givign away free bets; if you assume those bets are ~50/50, they’re effectively giving away $1.65k for a $3k deposit. Now, it’s not quite that bad, since you do need to do some betting to unlock all of that money, so Caesar’s will pick a little bit back in spread fees and everything…. but I just having trouble believing that the average customer Caesar’s is grabbing has a life time value of more than $1.65k.
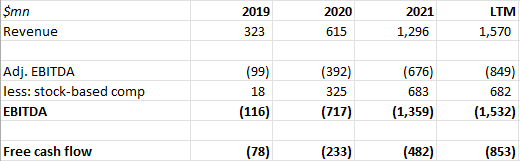
With sales and marketing expenses more than double its gross profits, DraftKings has been burning cash hand over fist:
(check out the stock-based compensation running at 44% of revenue!)
These financials are a horror show.
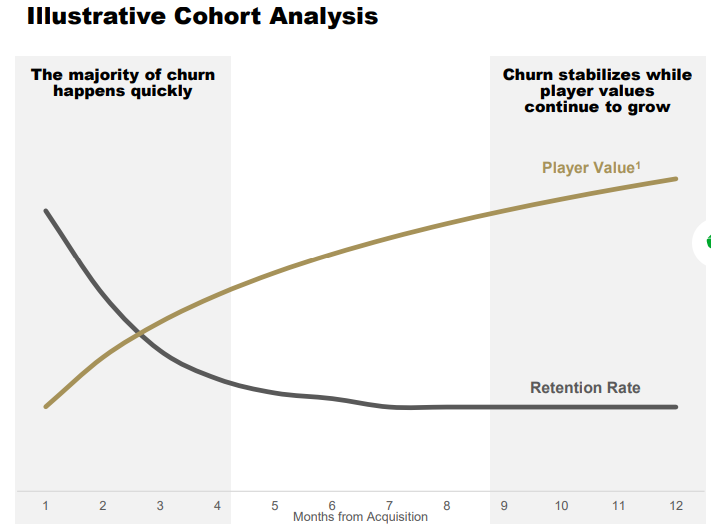
DraftKings will retort that 83% of acquired customers retain after 1 year, 70% after 3; that a given cohort, including churned customers, generates 122% of year 1 revenue in the second year, 143% in the third. That doesn’t resolve the lifetime value question since those retention and gross revenue figures may be sustained by ongoing promotions. Also, that BetMGM sees most of its acquired customers churn off in the first 4 months before leveling off – a progression that seems more realistic to me – makes me skeptical of Draftkings’ claims (or at least its presentation of those claims).
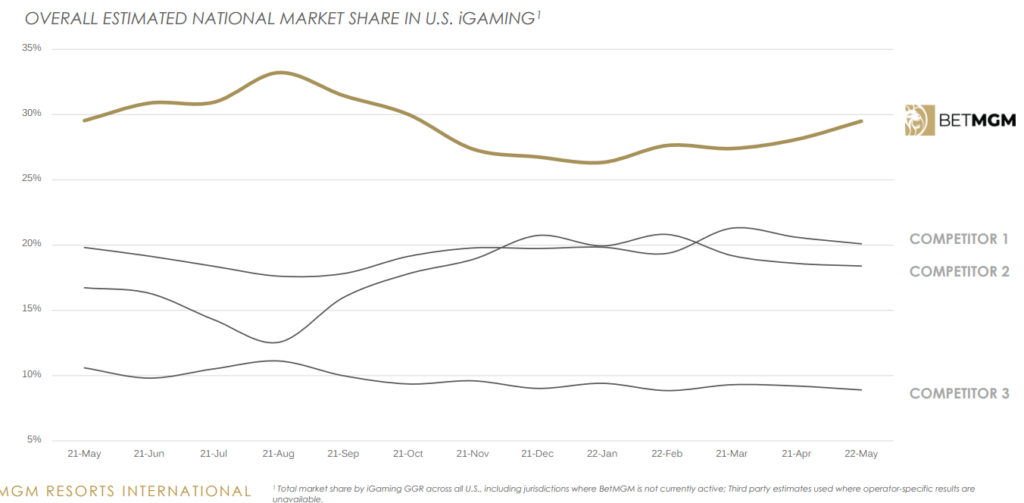
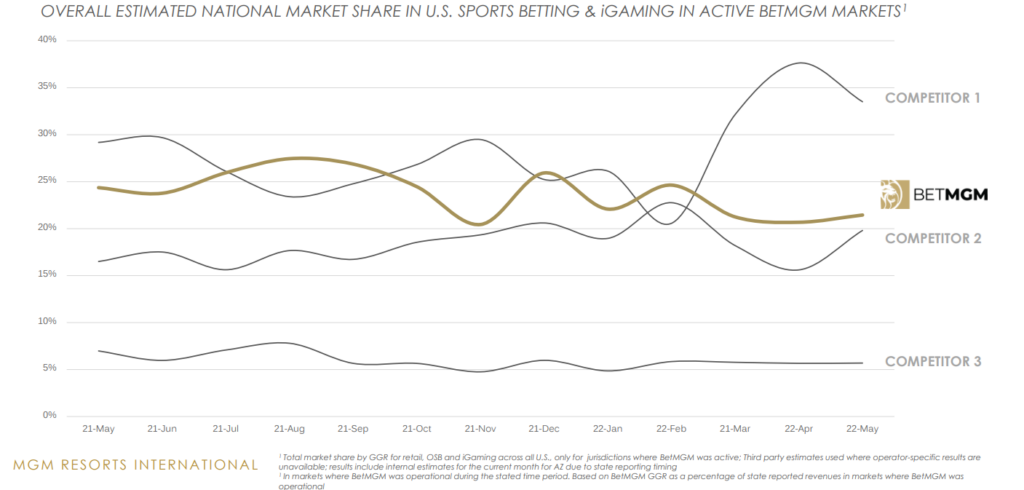
BetMGM sometimes trots out this exhibit to demonstrate their strong competitive position across OSB and iGaming:
But what’s more interesting to me is how wildly market share shifts from month to month based on the relative promotional cadence of each participant. To be fair, a bunch of states have legalized gaming over the past year on a low starting base, so a player who gets the jump in a handful of new jurisdictions by bombing new gamblers with promotional offers can quickly find themselves taking meaningful national GGR share even if their competitors do a good job retaining existing customers. Even at a state level, a similar low base effect may be at play. In New York, Caesar’s Digital debuted this year with absurdly generous promotions (see Andrew’s post) to win 41% of GGR, only to see its share fall to 15%-20% as soon as it cut back on marketing. But given how nascent the New York OSB market is, Caesar’s may still find itself losing share even as it retains GGR from existing customers if most of the incremental GGR is picked off by competitors who continue carpet bombing the market with promos. Like let’s say in the first few months of launch, state GGR grows to $10 against an addressable potential GGR of $100, with Caesar’s claiming $4. Caesars can retain all $4 of GGR after it pulls back on marketing and still see its market share reduced to 20% if DraftKings and FanDuel promo their way to winning 80% of the next $13 of state GGR. In short, share volatility may be less indicative of an unhealthy market than an early one.
It’s worth noting that if customer retention sucks, GGR may be a misleading measure of sustainable share because it doesn’t subtract promotions, which latter can be so high that they comprise the bulk of GGR – for instance, in 1q22, Caesars Digital reported negative $53mn of net revenue (as Caesar’s admitted, ”we were more aggressive than we needed to be out of the box”). PENN Entertainment, who has excoriated its spendthrift peers, likes to point out that it has grown share on a Net Gaming Revenue (NGR) basis with a far more abstemious marketing diet.
Source: PENN Entertainment
But this is misleading in the opposite way because PENN’s NGR share will naturally grow in the short-term if everyone else is busy depleting their own NGRs with big upfront promos. And if acquired customers really do retain (and gamble) at high rates without much incremental marketing, then PENN will lose NGR share as state markets saturate and DraftKings, etc. taper off their splashy promos. Notably, since it dramatically curtailed CAC, pulling hundreds of millions that it planned to spend on marketing, Caesars claims that its national handle share has remained steady at around 15%, so maybe it’s had some success leveraging its loyalty program and physical properties to build loyalty with online gamblers.
To me, the most compelling sign that all this promotional spending may earn a return after all is that DraftKings is consistently seeing positive contribution profits (gross profits minus advertising expenses) in states 2 to 3 years after entry, suggesting that promotional costs do indeed taper off as as the number of remaining customers left to acquire shrinks…which of course would only be possible if existing customers didn’t need to be re-engaged at the same cost over and over again. In 2018, its first year in New Jersey, DraftKings reported $10mn of contribution losses on $21mn in revenue; in 2021, they generated $68mn of contribution profits on $239mn of revenue (28% margins). Between 2018 and 2019, DraftKing launched in 5 states. 4 of them were profitable by 2021 and the 5th is expected to be by the end of this year. The 2-3 year ramp to profitability has been observed by BetMGM and Caesar’s as well, with the former realizing contribution profits in just 6 months in Michigan.
So the idea is that digital operators have reported horrendous consolidated losses over the past year because the upfront losses from seeding new, legalized markets are overwhelming the contribution profits from the few, early launch markets of 2018 and 2019. With online gaming now available to most of the addressable US population, the profitability picture is poised to flip around this year and next as the contribution profits from current legalized states more than offsets promotional launch costs in the relatively few remaining states who haven’t yet authorized online gaming but will. BetMGM expects to be EBITDA profitable by the end this year; DraftKings and Fanduel towards the end of 2023 (though with SBC such a huge cost add-back for DraftKings, does it really count?). The precise path of margin improvement is confounded by the timing of new state launches – for instance, marketing and promotional costs from a California launch will absorb profits that would otherwise have been realized from existing states. But at maturity, digital operators expect to generate margins that are comparable to retail casinos.
For this to materialize, Tier 1 operators need to somehow acquire and engage customers in a cost advantaged way. As is true of any consumer facing app, engagement means having a responsive app with compelling content. Some operators might start by renting third-party gaming platform from Kambi or GAN. But to enable differentiated experiences, like variations of in-play betting and personalized gaming, all the majors have or are on their way to fully integrating their tech, with DraftKings acquiring SBTech, PENN Entertainment acquiring theScore as they transition off Kambi, FanDuel leveraging the tech platform of their parent company, Flutter, and BetMGM doing the same with their 50% owner, Entain. Everyone licenses content from IGT, Scientific Games, and Evolution through revenue share agreements but they also seem intent on pushing exclusive first-party games. As of April 2021, 5 of BetMGM’s top 10 titles were created in-house by Entain and Entain content accounted for 25% of BetMGM’s YTD GGR. PENN’s Barstool Casino gets 20% of its handle from in-house games, which it expects to grow to 50%. BetMGM estimates that in-house technology alone provides a 7% to 12% margin advantage over those who rely on third-party platforms.
The Tier 1s can also acquire gamblers at lower cost by piggy backing on existing assets. DraftKings and Fanduel converted their dominant share in daily fantasy sports into dominant share in online sports betting. PENN Entertainment hopes to lure the 20 to 40 year old audiences of popular sports media properties, spending more than $2bn for Barstool Sports and theScore. MGM and Caesars, with rewards programs that boast 35mn and 65mn members, respectively, can cross-promote across online and offline properties. BetMGM players enrolled in MGM Rewards and redeem points from their online play for discounted room rates or concert tickets or whatever at MGM’s regional or Vegas casinos. MGM reports that BetMGM is the largest source of new MGM Rewards enrollees, with over 43% of Rewards sign-ups now coming from BetMGM compared to 33% a year ago. Once ensnared in the MGM ecosystem, sports betters can be cross-sold iGaming and vice-versa. Where iGaming and OSB are allowed, MGM reported in 1q that 44% of online bettors engaged in both. Omni-channel players are acquired at just 30% of MGM’s average CPA and are predicted to be nearly twice as valuable as single-channel players. Finally, in states where they run physical casinos, MGM and Ceasars aren’t burdened with fees9[32] that pure online operators like DraftKings and Fanduel must pay to land-based operators in order to gain market access. BetMGM believes this provides a 6 to 7 point margin advantage.
Of course, none of these advantages prevent a newcomer from nuking the market with sloppy promos and destroying everyone’s unit economics for a while, though whether they can do so profitably without the scale of current Tier 1s is another matter. There is no reason for a gambler to download apps from no-name Tier 2 operators with no offline complements and inferior content and gameplay experiences, except to take advantage of one-time promos that are unlikely to prove sustainable. ESPN, rumored to be breaking into OSB, has the brand and audience to leapfrog into Tier 1 contention, but they will be starting years behind incumbents who have the tech, mindshare and, at least for MGM and Caesars, an irreplicable physical presence and rewards program. Plus, Disney is already burning billions on their DTC efforts. Do they want to burn billions more scaling OSB at a time when shareholders are whinging about cash flows?
Anyways, given the scale requirements this seems like the kind of market that will eventually consolidate around ~2-4 players. Whether they operate as a disciplined oligopoly is TBD, but at least for now, everyone is swearing off shock-and-awe marketing and committing to adjusted EBITDA profitability by next next year. Caesars is scaling back its cumulative digital EBITDA losses from $1.5bn to ~$1bn. For a while, DraftKings and Fanduel were granted permission to spend profligately while MGM and Caesars, whose shareholders were accustomed to free cash flow, were somewhat more constrained. But now even investors in hyper-growers are punishing growth at any cost (which comes with the silver lining that no new entrant will have the leeway that today’s iGaming incumbents have enjoyed the last 4 years).
Coincidently, DraftKings has guided to the same 30%-35% long-term EBITDA margin guidance that BetMGM has put out there, which doesn’t make much sense. Setting aside that DraftKing’s margin target is totally meaningless as it surely excludes massive stock-based comp, BetMGM has more efficient marketing thanks to its rewards program and doesn’t pay access fees in states where it operates physical casinos. And while DraftKings is already enjoying 28% contribution margins in New Jersey, the 13% gaming tax rate in that state[33] is well below the average 19% sports-betting tax rate in the US[34]. In New York, OSB operators are required to pay 51% of GGR for the first 10 years! DraftKings is also far more tilted to sports betting, whose mid-single digit percent of handle is well below the take rate on slots and table games, though tax rates on iGaming are higher than OSB and iGamers, according to MGM management, are also more expensive to acquire, so maybe it’s ultimately a wash.
Could OSB and iGaming cannibalize retail handle? Well so far, there’s no signs of this happening. Gaming revenue across regional and Las Vegas casinos is at or near record highs. In New Jersey, where iGaming was legalized in 2013, physical casino revenue has steadily grown and actually accelerated in 2019, the first full year of online sports betting.
Source: PENN Entertainment
Even if cannibalization eventually manifests, I think destination casinos like the kind MGM over-indexes to should be relatively more immune than mid-tier properties run by Caesars and PENN. We’ll see.
So look, I’m far from sold. But if the cohort contribution margins of the last 4 years are indicative of how market profitability evolves then iGaming/OSB looks like a call option that is getting more in the money with every passing quarter and, in my opinion, omni-channel operators like MGM and Caesars, with their rewards programs and offline complements, are best positioned to capture the spoils. BetMGM thinks that “long-term” (let’s call it 5 years) it can acquire 20%-25% the US market (conservatively pegged at 38% of the adult population as it excludes California and Florida), at EBITDA margins of over 30%. DraftKings thinks it can do $2.1bn of adjusted EBITDA on net revenue of ~$7bn (assuming 64% population penetration for OSB and iGaming in Canada and 65% and 30% penetration in US OSB and iGaming, respectively, compared to 46% and 13% today). MGM’s share and margin estimates get you to around the same place. So $2bn EBITDA at 10x, discounted back 5 years at 12% would mean that MGM’s 50% stake in BetMGM is worth around $5.7bn today, or about half of MGM’s US market cap. Or the whole thing could be shut down as the economics prove unsustainable. With MGM shares priced at 11x maintenance free cash flow, I don’t think the call option is priced in.
Stepping back, a conservative IAC sum-of-the-parts looks something like this:
MGM is cheap for all the reasons discussed. BetMGM and the Japanese venture, should they pan out, adds another ~$1bn of value to IAC in present value terms. MGM China is operating at trough profitability due to draconian zero COVID measures that will be eventually be relaxed.
Angi’s has been a big disappointment so far. I got this one wrong. The plain speaking optimism that I once found refreshing has now gotten annoying as it fails to be backed up by the financials. “It’s still early days”, but 2-3 years into the fixed price BHAG, we should at least be getting disclosures on the unit economics of the most mature service categories. Instead, the only profitability guidance we’ve gotten, besides vague and inconsistent qualitative color on contribution profits, is that gross margins across Angi Services are between 15% and 35%, a range so wide as to be meaningless. If product snugly fit market, I feel like Services would be growing at least 50% y/y organically at this early stage. Instead, the business is now growing low-teens, more like ~30%+ when you back out roofing, where they “just got ahead of ourselves in aggressiveness on price and some other operational challenges”.
I fear Angi’s challenges aren’t just temporary. The combination of Handy, a growth oriented “tech” company run by 20-30 year-olds in New York and HomeAdvisor, a more old-fashioned smile-and-dial outfit based in Denver, has resolved into cultural tensions. Feedback from contractors, who often don’t understand or appreciate the ROI math of Angi leads, ranges from “meh” to “bleh”. I have yet to encounter a contractor who thinks of Angi’s as a critical, must-have lead gen channel. Angi’s employees seem to have a short-term, mercenary bent, with a former Handy Sr. Director of Operations and Strategy commenting (h/t Stream Mosaic[35]):
the attrition rate is very high, because of that, you need to bring in a lot of people. Like my example earlier, if you hire 100 people, you might be lucky if five of them make an entire year. I was in a training class of around 30 people, and by month four or month five or maybe month six, I was the only person in my training class left. Because it’s such a high attrition rate, you’ve got to really fill the top of your funnel of employees. You’ve got to fill it to the maximum. It’s very easy to get hired once you apply. There is not a lot of requirements, they’re not very stringent.
While Angi’s might provide reliable service in a dense city like New York (Handy’s HQ), at least here in Portland, OR, I literally it easier to find contractors on Google than I do on Angi’s. In short, I just don’t get the sense that people love working for Angi’s or that the service is particularly compelling to either service providers or consumers.
DotDash is no longer expected to hit $450mn of EBITDA next year due to a “rapid pullback” in ad spend from Retail, CPG, and Food verticals, but I’m still constructive on the long-term story. You’ll recall that last December, DotDash acquired the publishing division of Meredith with the idea of applying its expertise running fast, clean websites to Meredith’s storied brands, which include Southern Living, Better Homes & Gardens, and Martha Stewart Living (consider that Better Homes & Gardens is searched 11x more frequently than DotDash’s analogous home-focused property, The Spruce, yet gets just half as much online traffic). In 1q, Health.com[36] was the first Meredith property to migrate to DotDash’s platform. With 30% fewer ads and 5x the site speed, click through rates increased by 60%, programmatic ad rates by 50%. Since then, 6 more properties have transitioned, with similar site speed gains. I am valuing DD/Meredith at 11x this year’s EBITDA, arguably too conservative for an asset growing revenue 15%-20% with minimal capex requirements and 50%-60% incremental margins.
Most of the remaining IAC is a collection of unprofitable, binary VC-type bets that nobody wants in today’s cash flow sensitive market environment. But IAC’s valuation is so bombed out that you can mark it all zero. MGM, DotDash, and Angi’s alone more than cover the enterprise value after subtracting the value of corporate overhead. Or you can put a zero on ANGI, as the sum of the remaining parts, marked conservatively, also cover IAC’s valuation.
Disclosure: At the time this report was posted, accounts managed by Compound Insight LLC owned shares of IAC. This may have changed at any time since.[Update: as of 2/21/23, accounts managed by Compound Insight LLC no longer owned IAC shares]
Class 1 freight rails: part 3 – Hunter Harrison, PSR, and investment implications
Posted By
scuttleblurb
On
In
Class 1 rails,SAMPLE POSTS |
No Comments
No analysis of the North American railroad industry would be complete without a discussion of Hunter Harrison as no single person has had a bigger impact on the operating performance of Class 1 railroads over the last 25 years. A lifelong railroader who began his career oiling railcars in the early ‘60s when he was just 19 years old, Hunter had turned around 3 railroads (Illinois Central, Canadian National, Canadian Pacific) and was on his way to reviving a fourth (CSX) by the time he passed away in 2017. The principles enabling the dramatic productivity gains at the companies he steered are codified as Precision Scheduled Railroading.
Before PSR took hold across the industry, trains would not depart until fully loaded. They would wait for every shipper’s car to be hitched, such that an outbound train to Kansas City could be idling in Oklahoma City for 14 hours until the arrival of an inbound train from Houston, which in turn would hold up the train from Kansas City to Chicago, etc. Waiting optimized for longer trains but also had the nasty side effect of congesting yards and impeding on-time delivery, much like globules of cholesterol clog the arteries of a circulatory system, preventing blood cells from delivering oxygen to organs. What Hunter Harrison envisioned was a fluid system, one where the right payloads would get to the right place at a scheduled time.
In a network, where nodes are reliant on other nodes for traffic, a constriction here can create delays over there, which can cascade into hold ups over there, etc. Anyone who has flown commercial intuitively understands this. Like airport terminals jammed with stranded passengers, yards of mounting railcar inventory are symptomatic of a sick network. It follows then that a healthy network is one where cars are in constant motion, as approximated by dwell time (the amount of time a railcar spends waiting at a terminal) and, relatedly, car speed (distance divided by time, with time going down as cars spend less time idling at terminals). A train with 200 cars is preferable to one with 80 – same fixed cost of fuel and crew spread across more payload – but those cost savings are for naught if the time spent building longer trains causes delays that create inefficiencies elsewhere. That’s not to say train length doesn’t matter. Just that it is optimized within hard scheduling constraints – fewer pickups with strict take-it-or-leave-it departure times – rather than according to the whims of a customer.
PSR dictates that a railroad optimize car movement across the entire network rather than hit local maxima. In the same way that UPS concerns itself with the on-time door-to-door delivery of packages than with the movement of its trucks, so too do PSR proponents emphasize the predictable delivery of carloads from origin to destination rather than the speed and on-time performance of its trains. It doesn’t matter if a train gets from one yard to the next in record time if the railcars it unloads just sit there awaiting pickup for days.
I certainly don’t understand the intricacies of PSR well enough to get into the fine-grained details of how this is done (and in any case, describing the nuances of a rail network in an essay is kind of like inferring the shape of a complex 3D object from its 2D shadow) but at a high level, scheduled railroading demands simplification, which in practice means: removing hump yards (hundreds of acres of track-laced land where incoming railcars are sorted according to shared outbound destinations), including the associated infrastructure and supervision required to manage its multiple processing steps, and switching trains at smaller flat yards instead; discarding underutilized lines and shuttling longer trains on more direct routes; commingling different freight types to drive incremental volume without additional train starts; and yes, pissing off customers forced to adapt their logistics to the rail rather than the other way around.
Managing network health holistically has all sorts of benefits. Point-to-point hauls lead shorter transit times and more reliable delivery, in the same way flying direct does. Keeping more trains in motion longer means fewer locomotives and railcars for a given volume of freight, which means fewer crew members to drive those trains, fewer mechanics to maintain them, and fewer yards to hold and switch them (with the freed up land either sold or repurposed into warehousing and transloading facilities that bind a railroad closer to their customer). It means the railroad can raise wages for the remaining workforce and still realize margin gains as trains haul freight over longer distances for every hour a unionized employee is paid. It means they can reserve less inventory, parts, and shop space to repair trains and mix toward a newer, lower maintenance fleet as the trains removed from action are the oldest, least fuel efficient ones most in need of care. It means they can stand behind superior service that shippers will pay up for.
These changes don’t comes naturally for a railroad constructed piecemeal through the acquisition of hundreds of smaller lines with parochial interests. Before Hunter Harrison took over, CSX had like 10 divisions that were run as independent companies, each with its own dispatch center and hump yards. Scheduled departures and holistic network-wide considerations were arguably as radical a break from industry tradition as Ryanair enforcing single class seating, operating a single model of aircraft, and targeting less congested airports to hasten take-off times.
Culturally, PSR espouses the philosophy of continuous improvement, a mindset that encourages managers to ask “why” and challenges conventional practices (if a hump yard is the final destination for 10% of cars, why not shut it down and find more efficient routes for the other 90%?), much like the Danaher Business System. The image of Danaher executives on factory floors redesigning machine layouts mirrors that of Hunter Harrison at trainyards listening to radio comms between supervisors and yardmasters or checking into a hotel with a set of binoculars just to evaluate yard operations10[37]. Whether HH studied DBS/kaizen explicitly, he certainly embodied its spirit in his disdain for bureaucracy and the trust he placed with local decisionmakers who were closest to the action and made accountable for results.
Even if Hunter Harrison was the first to clearly see the consequences of PSR, by the early 2000s its basic principles were widely understood, having first been successfully executed at Illinois Central during the early ‘90s. Really what was missing was the will to pull it off. The industry had ossified into cozy regional duopolies run by old timers, insulated within layers of bureaucracy, who prioritized politeness over performance and stasis over speed, who had for so long been steeped in a culture of mediocrity that they had never considered what was possible. And fair enough! Even a go-getter with fresh eyes might observe that rail systems operated as part of a complex ecosystem that had evolved over the course of centuries and assume a Chesterton Fence explanation for why the industry worked the way it did.
Pulling off the radical changes required for step-function improvements required not only “thinking from first principles” but a tone deaf disregard for the way things had always been done. Because the idea of constantly looking for ways to take assets out of the system by operating more efficiently was a direct threat to legions of rail managers accustomed to thinking that problems were solved by throwing resources at them, that their career value corresponded to the scale of assets under their purview, that the customer always came first. Hunter flatly disagreed:
At a conference years later, Harrison recalled Burlington Northern had put stickers up all over its operation that said “The customer is always right.” Harrison joked to a roomful of railroaders that he went around ripping the stickers off the wall. He’d come to the conclusion that if you said yes to everything the customer wanted, you wouldn’t make any money (excerpt from Railroader)
Before PSR proved its value at one major railroad after the next, it had to be imposed by iron will. That even the most basic and obvious improvements – like requiring people to work the full 8 hours they were paid instead of finishing a task in 4 hours and bouncing for the day or having two trains traveling in opposite directions swap crews halfway through their destinations to avoid the lodging and meal costs of overnight stays – were somehow overlooked testifies to just how complacent these organizations had become. Only a renegade insider who eschewed internal politics and dishonored tradition could scythe through layers of bloat and mismanagement.
For every time Hunter parachuted into an ailing railroad, he faced resistance from those who could not fathom the idea that they had been doing it wrong this whole time. Skeptics objected that the turnaround at Illinois Central, a regional Class 1 whose Operating Ratio (expenses divided into revenue) collapsed from the high-90s down to 62% under Hunter’s tenure, couldn’t be replicated on a larger scale in harsher climates…until Hunter took the reigns at the transcontinental Canadian National, who had 5x the revenue, and dragged the OR from 79% to 62% over 10 years. At Canadian Pacific, where the OR plummeted from ~80% to 60%, the mountainous Western terrain did not dilute the impact PSR as doubters predicted. Nor did the “spaghetti bowl” network of short lines at CSX, whose OR has improved from ~70% to 60%.
Despite a harsh temperament and a rambunctious, hard-nosed style that clashed with the demure, buttoned down sensibilities of the Canadian railroads he commandeered, Hunter was also known to be an inspirational mentor who had a sharp eye for talent and took considerable time to foster it. At luxurious retreats, Hunter Camps, he schooled promising managers on the merits of PSR and is today survived by loyal disciples who have carried on his work at other companies, including James Foote and Jamie Boychuk at CSX, Jim Vena at Union Pacific, John Orr at Kansas City Southern, and Keith Creel at Canadian Pacific.
But PSR has not been without critics. With labor reductions making up the largest component of OR gains by far, some believe that PSR ultimately boils down to draconian cost cuts that eventually come back to bite its practitioners in the ass. CSX suffered major issues as they began executing the PSR playbook in 2017. NSC, 3 years into PSR, is now facing fierce criticism over the disastrous derailment of a 149-car chemical train that led to the evacuation of a small town this past February. And just look at the degradation in service and operating margins caused by the whipsaw of post-COVID demand patterns and the consequent scramble to replenish crews that had been so enthusiastically cut in years past. Moreover, while PSR may have rewarded shareholders, skeptics will argue that those gains have come at the expense of certain unionized employees, who claim they are subject to more dangerous working conditions, and shippers, who at great cost and inconvenience have had to reconfigure their own logistics to strict time tables or have had their service interrupted as railroads concentrate on the most profitable corridors, in possible violation of common carrier obligations that require them to transport all approved freight at reasonable terms.
First, I think the immediate disruption arising from radical change can be a poor gauge of whether that change ultimately makes sense. If commercial airlines operated the same way freight rails did 20 years ago, maximizing for load factor by holding planes on the tarmac until all ticketed passengers arrived, I’m sure that suddenly switching to strict departure times would have provoked fierce resistance from passengers who liked the way things were before. But if we had to write commercial aviation rules from scratch, who would argue against non-negotiable departure times? Likewise, PSR is bound to provoke complaints, especially early in its implementation, as it forces shippers to alter their operations and nobody enjoys having change forced upon them. Some may even be made permanently worse off than before. But beyond the initial stages of disruption, a fluid network with more reliable delivery times is probably better for the modal shipper and the logistics ecosystem as a whole.
Second, railroads aren’t set up to handle outsized fluctuations in volume. While it is tempting to point to PSR as the primary culprit behind the service disruptions last year, consider that BNSF, who has long resisted PSR, and NSC, who didn’t start scheduled railroading until 2019, were among the 4 Class 1s harangued by the Surface Transportation Board for deficient service. In an alternative history where PSR wasn’t adopted at all, would the industry have managed post-COVID disruptions better? I’m skeptical. From what I gather, service issues emerged because railroads, like many other industrial companies, mis-calibrated the shape of demand: they were too quick to lay off employees in response to the sudden collapse in volumes early into the pandemic, leaving them ill-equipped to manage the unexpected surge in demand that shortly followed in a very tight labor market.
Third, describing PSR as little more than a brute cost cutting program gets it backward. For the most part, cost reductions aren’t the cause of efficient operations, they are the consequence. A network that has been reconfigured to facilitate car movement, leading to less yard inventory and fewer jams, should require fewer trains, fewer yards, and less labor than before. Also, while PSR adopters are sometimes accused of skimping on capital investment, the reality is murkier. While it’s true that reductions of locomotives and railcars follow from PSR-driven efficiency gains, the vast majority of a railroad’s capex is concentrated in track infrastructure. CP spent more on capex as a % of revenue in the 8 years after PSR, and over the last decade CP and CN have each spent proportionally more than PSR holdout Burlington Northern (20% vs. 17%).
On the other hand, CSX has cut back on capex dramatically, from ~20% to low-teens of revenue, since starting PSR. But I would caution against drawing hard conclusions from that because looking back far enough in history, you will often find multi-year stretches of low capex followed by big spikes. For instance, while CSX was running capex at 20% of revenue in the 6 years prior to starting PSR in 2017, in the 6 years from 2004 to 2009 they were at only 15%, right where they are today.
Finally, I don’t see much evidence to back the claim that resource take-outs accompanying PSR have degraded safety:
The clear outlier here is Canadian Pacific, whose accident, derailment, and injury stats have improved considerably in the decade since PSR was adopted. And CN’s injury frequency rate dropped precipitously after PSR, from 7.3 per 200k person-hours in 1999 to just 1.8 by the time Harrison retired11[39].
In a report from last December, the US General Accountability Office concludes:
Federal Railroad Administration (FRA) officials stated that data from 2011 through 2021 are inconclusive about the extent to which operational changes associated with PSR may have affected rail safety, but have taken steps to address potential risks. Class I railroad representatives generally stated that these operational changes improved or had no effect on railroad safety. In contrast, rail safety inspectors and employee unions identified safety concerns related to reductions in staff and longer trains.
In general, I find the idea that efficiency comes at the expense of safety to be a little odd in that accidents cause downtimes and are terrible for smooth operations. Can you think of an industrial company that has simultaneously sustained above average returns with below average safety? When executives declare “safety is our number 1 priority” they do so not just because it is one of those nice things you’re supposed to say to signal responsible corporate citizenship to regulators (you wouldn’t want to stand out as the only railroad not leading earnings calls with a shout out to safety) but also because safe working conditions really are a necessary precondition for operating efficiently. No altruism required. A selfish drive to maximize profits will also motivate you to minimize injuries.
I guess where I land is that 2022 was just an exceptionally disruptive year that would have confounded any railroad, PSR or not. It’s likely that some PSR programs were too aggressively implemented. But this seems more like an overshooting issue to be tweaked through tactical adjustments than an indictment of PSR as an operating model. In fact, CSX and NSC appear to have fully recovered and Union Pacific is on its way.
But if PSR has ambiguously impacted service and safety, it has been the indisputable driver of the industry’s efficiency gains over the past decade or so.
Or has it?
This seems like a silly question at first blush. After years of stagnant and below average margins, is it reasonable to think that CN, CP, and CSX would have suddenly whipped themselves into financial shape without Hunter Harrison’s guidance? Probably not.
On the other hand, most Class 1 rails were already seeing major OR reductions before they adopted PSR. This includes BNSF, who explicitly eschewed the philosophy:
So maybe the margin improvements attributed to PSR would have come even if the world had never heard of Hunter Harrison.
But I have a hard time believing that. In 2005, with the exception of CN, who was then 7 years into PSR and boasted the highest margins in the industry by far, Class 1 operating ratios were no better than they were in the early/mid-’90s. Then out of nowhere the US players, none of whom had yet explicitly embraced PSR, cut their OR by 16 points over the next decade. For me, the most resonant explanation is that Hunter’s influence seeped through every major railroad, either directly through the changes he imposed or indirectly in the pressure he created for everyone else to match the productivity gains wrought by PSR. With CN and then CP, Harrison, with the backing of prominent activist Bill Ackman, proved what was possible, both to peers but also to investors, like Roger Bannister breaking the 4-minute mile. No self-respecting Class 1 management team would have been permitted to continue reporting ORs in the high-70s/80s with CN reporting low-60s and CP trending that way immediately after HH took charge in 2012. The industry had a fire lit under its ass. Hunter was holding the match.
A reasonable pushback is that while PSR may have fueled margin expansion, its impact on ROIC has been more ambiguous. For CP, Hunter Harrison’s influence is clear cut and obvious.
Less so at CSX. While pre-tax returns improved from ~15% in 2016, the year just before HH came onboard, to 18% 3 years later, in 2016 the industry was still in the midst of a mini-industrial recession that it clawed out of by 2019. There is no difference in CSX’s 5-year average ROIC before-and-after PSR.
But we have to consider the counterfactual. What would returns have been under the status quo? Whether or not PSR was adopted, capital requirements would have outpaced revenue growth. Operating efficiency was the key lever railroads had to counteract this effect. Compared to UP, PSR-holdout BNSF has reported higher ORs (lower operating margins) every single year over the last decade.
Meanwhile, both companies generate about the same amount of revenue per dollar of capital, a figure that has declined by a similar amount over that period. The net result is that BNSF’s pre-tax returns on capital have deteriorated a bit over the last decade, from 19% to 16%, while UNP’s has at least remained stable at ~20%.
It’s interesting to observe that while the industry is converting revenue into far more EBIT than they did 10 years ago, every dollar of EBIT still requires about the same amount of capital to generate as before, another reminder that these are very capital intensive businesses and even significant margin gains can be a misleading indicator of the degree of value creation. But like it or not, operating ratio improvements, and the GAAP earnings growth that come along with it, move rail stocks.
All the Class 1s except CN have compounded by low-teens and outperformed S&P 500 over last ~decade.
Around ~2.5% of that compounding has come from multiple expansion:
The remaining ~11% tracks per share earnings growth.
You’ll notice that CP stands out as the most richly valued Class 1 by far. I can certainly understand the valuation at the end 2012. CP had the lowest operating margin and ROIC, but Hunter Harrison had just come onboard as CEO to turn things around. Given his success at CN, there was strong reason to believe profitability would inflect. And that’s exactly what happened. The once ailing railroad went on to grow earnings per share by ~16%/year over the next decade, faster than any of its peers. Now it generates the highest returns on capital of the Class 1 rails. Even with its premium starting valuation, CP’s shares have compounded a much higher rate than peers.
But is it reasonable to expect similar performance over the next 10 years?
On the one hand, CP is steered by Keith Creel, who was Hunter Harrison’s right hand man for 30 years and has become an industry legend in his own right. With its recent acquisition of Kansas City Southern, CP is an obvious beneficiary of nearshoring. Between “base growth” (3%-4%), inflation+ pricing (3%-4%), and synergies (2%-3%), management is guiding to high-single digit revenue growth from 2024-2028 at the low end. Moreover, KCS only started its PSR journey in 2019, so on top of the revenue synergies maybe CP also surprises us with margin accretion from low-hanging productivity gains.
On the other hand, there’s a big difference between paying 23x for earnings that are about to massively inflect and paying 27x earnings that have already massively inflected! And if the low-end of CPKC’s revenue guidance for 2024-2028 (8%) is ambitious but plausible – adding ~2%/year of revenue synergies to the trailing 10-year ex. coal revenue CAGR gets you to ~7% – the high-end (11%) feels far-fetched. To put this in perspective, like CP+KCS, the last 2 major Class 1 mergers – between Burlington Northern and Santa Fe in 1995 and between Union Pacific and Southern Pacific in 1996 – also created more direct route routes across more O/D pairs. In the 4 years following their mergers, BNSF grew by 3%, UP by close to 5%. Over 10 years, both companies grew by 6%. So considering CP’s standalone historical revenue growth rates (5% over the last 10 and 20 years) and the growth rates generated by other Class 1s post-merger, the base rates supporting 8%-11% growth don’t seem all that favorable.
More generally, railroads have talked a big game about improving growth for years and years. But the fact of the matter is that Operating Ratio, while sometimes derided as a crass oversimplification of what really matters, seems to be the singular metric that both matters and is reliably under a railroad’s control. And the extent to which it can improve from here, after steadily compressing over the last 20 years, is a key question hanging over the industry.
In the decade from 2002 to 2012, the average Class 1 OR improved by 12 points, from 82% to 70%. Over the following decade, a period during which all major railroads (except BNSF) adopted PSR, it improved by just 8 points, from 70% to 62%. With everyone now at least 3 years into their PSR programs, is it reasonable to think the industry enjoys comparable gains over the next 10 years?
Tying OR to its operational drivers can be a somewhat helpful intuition pump…for instance, CSX’s former CEO Jim Foote noted back in 2019, when the railroad was managing an OR of 60%, that a reported velocity of 20mph implied their trains were idling at yards 60% of the time, given that a train in motion travels at speeds of ~50mph. Though I’m then left wondering what a reasonable idle percentage should be, as well as the quantitative impact that improving it has on OR? I’ll just say that generally speaking there always seem to be more ways to optimize complex operations. The constraints to doing so are often rooted in culture than in physics. After decades generating 10%-15% EBIT margins, I’m sure the dudes running large railroads in the ‘90s were convinced they had hit a natural OR floor. Who among them would have believed a network with more than 20k+ route miles could get hit low-60s? CP’s OR trundled along between 75 and 80 for a dozen years. Then Hunter Harrison lobbed off 20 points in just 4. And if you’ve ever researched Danaher, you’ll no doubt have heard stories of managers at acquired companies, cock sure that they had run the productivity well dry after decades, stunned at the gains subsequently realized through DBS. Alongside process improvements, the industry has a long history of applying technology to reduce fuel and maintenance costs – devices that automatically shut down locomotive engines to reduce idling, GPS coordinates and velocity data to better predict arrival times, machine vision systems that inspect components while the train is in motion, sensors that pickup the irregular sounds of defective bearings.
At the same time, one reason I find it hard to gauge the pace of improvement from here or to even know what a realistic OR might be is that we don’t have a benchmark to anchor to. In 2011, if you were looking at a railroad with an 80%+ OR, you could look to CN, who had sustained sustained an OR in the 60s for more than a decade, as an aspirational anchor. That’s especially true if this railroad were CP, who ran a similar east-west network in Canada. I completely get now why Pershing Square, with Hunter Harrison in tow, found this opportunity so compelling. Today though, you’re running a mile before knowing it can be done in under 4 minutes. There is no outlier OR to to show us what’s possible. A few railroads reported 55% ORs, but only for a year or two. All the rails are bunched up with ORs around 60. The difference between the highest and lowest OR is just 6 points compared to 18 points in 2011.
We should also consider regulatory obstacles. The STB is now headed by a particularly enthusiastic Chairman, Martin Oberman, who was appointed to the role by President Biden in 2021 and, according to a statement he released last year amid railroad disruptions “has prioritized enhancing competition in the nation’s rail industr[40]y where too many rail customers are captive to a single large railroad and for that reason often lack bargaining power to obtain better rail service and competitive pricing for their shipments”. The effort to “enhance competition” is expressed through a renewed interest12[41] in Reciprocal Switching rules, which require an incumbent railroad to transfer traffic to a competing railroad at a nearby interchange point in return for a fee. For the rules to take hold, historically shippers had to prove that a rail carrier had engaged in anticompetitive conduct, which was apparently very hard to do. Now, Oberman is proposing a lower hurdle that requires the shipper seeking RS relief to merely show that it is “practicable and in the public interest” or “necessary to provide competitive rail service”[42]. The proposal basically introduces competition by giving captive shippers the opportunity to source service from a nearby alternative carrier.
You can see why the Class 1 railroads hate this. They make their money hauling as much freight for as long as possible and, assuming certain conditions are met, the new RS proposals might require a railroad to transfer profitable traffic at the point where a competitor can move it more efficiently and at lower cost (according to rails.com[43], at an STB hearing in March ‘22, Oberman criticized Union Pacific[44] for routing chemical traffic from the Gulf Coast to the East coast by interchanging with competing rails at St. Louis, adding 335k extra miles a year unnecessarily).
Railroads retort that their networks have emerged through a long series of considered trade-offs that take into account differential route density, balance, and terminal congestion, and that re-shuffling the decks would throw everything into disarray, especially now that most everyone has adopted some form of precision scheduling, which requires a degree of resolution into the goings on of a network that is obfuscated by arms-length switching obligations. Accommodating interchange with competing carriers could require unplanned re-allocation of resources on short notice. The uncertainty unleashed by the proposed RS standards could disincentivize investment. Why build more terminal or storage capacity if you could be forced to interchange a competing rail’s traffic there or if you can’t accurately estimate volumes? In essence, the industry argues that any putative benefits from greater competition would be more than offset by coordination costs, operational complexity, and ultimately degraded service levels.
But the rail industry is prone to histrionics when it comes to resisting unfavorable change, like a soccer player wailing in exaggerated agony at the slightest contact. Canada has been subject to regulated “inter-switching” since the early 1900s[45]13[46], and CP and CN have long been among the two most efficient players. Also, reciprocal switching at flat fees are a common outgrowth of major US railroad mergers. Union Pacific and Burlington Northern were both forced to grant significant traffic rights to competing rails as conditions to acquiring Southern Pacific and Santa Fe, respectively, which did nothing to impede their productivity gains in the ensuing years.
In 2016, the last time reciprocal switching reform was seriously discussed in the US, Hunter Harrison remarked that in Canada few customers took advantage of “inter-switching” (as it’s known there) and predicted that just as inter-switching had “no impact” on CP’s business in Canada, it would be a non-event in the US. Of course, whether that’s true will ultimately turn on the details (we’ll know more by the end of this year or early next year). But given the systemic importance of this industry and the unpredictably large ripple effects that seemingly minor disruptions can have across networks and thus the industrial economy, I expect common sense and incrementalism to prevail over over ideology and radical change, especially now that the service disruptions of last year have largely corrected. If I had to guess, I’d say RS rules will be a fallback that shippers rely on to address blatant anticompetitive abuses rather than a bargaining tool used in the everyday course of business.
But even assuming the Oberman is more bluster than bite, I’m still left wondering how much margin expansion is reasonable from here. Let’s be optimistic and assume CPKC compresses OR by 10 points (including cost synergies from the merger) and the others do it by 8 points over the 7 years, which is about as much improvement as the industry realized over the last decade. Further, let’s assume CPKC grows revenue by 8% a year and that the rest of them grow 1 point faster than they did over last decade, ex. coal (i.e., CSX grew ex. coal freight revenue by 2.5% from 2012-2022, so I assume they grow by 3.5% over the next 7 years). With onshoring trends taking hold and ESG considerations rendering trains (4x more fuel-efficient than trucks) a more attractive transport option, it could be reasonable to expect somewhat faster growth in the years ahead, who knows. Still, I consider these growth rates more optimistic than realistic as railroads have in the past gestured at themes – whether that be rising meat consumption in emerging markets, crude-by-rail, frac sand, biofuels, energy reform in Mexico, electronic logging devices tightening truckload capacity, etc. – that, however promising, have proven small fragments in the massive mosaic of the anemic industrial economy.
With industry capex running about 1.5x-2x depreciation over the last decade, only about ~70% of net income has dropped down to free cash flow on average over time, though there is wide range across names, with CP at ~60% on the low end and UP at 80% on the high end. Let’s say “normalized” conversion is 75% and slap a year 7 free cash flow multiple of 30x on CPKC, 25x on CN and UP, and 20x on CSX and NSC, which roughly corresponds to their ordinal valuation ranking today (simplistic, I know…let’s just get through this ;). After applying those rosy assumptions, you’re still only compounding 11% on CN, 10% on CPKC, CSX, and NSC, and 9% on UNP. And let’s not forget that capital turnover (revenue/capital) has generally trended down over time and that OR gains have only gone toward compensating for those declines to maintain ROIC.
(I made an educated guess for CP in 2021 and 2022)
Were capital turnover continue to fall without a corresponding OR offset, returns on capital would deteriorate and these names could be hit with multiple compression on top of lower than expected earnings.
In short, the railroads are a mature, consolidated industry, more or less prohibited from large scale M&A. What’s mostly in their control boils down to capital allocation, which is more or less undifferentiated across Class 1s and frankly hard to screw up too badly in an industry with such high levels of long-term business certainty (we don’t need to handicap “metaverse” type bets that someone like Meta might feel forced to make to fend off existential platform concerns), and operations, where I think margin expansion will continue but at a slower pace as the most profound PSR-fueled efficiency gains have likely already been realized.
(I drew on Great Railroad Revolution and North American Railroad Family Trees for much of the historical content contained in this post. Both books are great resources if you’re interested in understanding how the North American rail industry has evolved over time, starting way back in the 19th century)
CSX: The Old School “Monopoly”[53] by Mostly Borrowed Ideas (nice overview of CSX and the North American rail industry, including some useful charts and maps)
Disclosure: At the time this report was published, accounts managed by Compound Insight LLC did not own shares of any company mentioned. This may have changed at any time since
[EQIX – Equinix; INXN – Interxion] Network Effects in a Box
Posted By
scuttleblurb
On
In
SAMPLE POSTS,[EQIX] Equinix,[INXN] Interxion Holdings |
Comments Disabled
The “internet”, as the name implies, is a network of networks. Scuttleblurb.com is sitting on server somewhere connected to an IP network different from the one your device is connected to and the fact that you are reading this means those two networks are communicating. Likewise, if your internet service provider is Charter and you’d like to send an email to a friend whose ISP is Comcast, the networks of Charter and Comcast need a way to trade data traffic (“peer” with one another). In the nascent days of the internet, different networks did this at Network Access Points established and operated by non-profits and the government. Over time, large telecom carriers, who owned the core networks, took control of coordinating peering activity and small carriers that wished to exchange traffic with them were forced to house switching equipment on their premises.
Eventually, most peering agreements moved to “carrier-neutral” Internet Exchange Points (“IXs” or “IXPs”, data centers like those owned and/or operated by Equinix and Interxion) that were independent of any single carrier. Today, global carrier neutral colocation/interconnection revenue of $15bn exceeds that of bandwidth provider colo by a factor of two as major telcos have seen their exchange businesses wither. At first, service providers landed hooks at these neutral exchange points…and then came the content providers, financial institutions, and enterprises, in that order. Customers at these neutral exchange points can connect to a single port and access hundreds of carriers and ISPs within a single data center or cluster of data centers. Alternatively, a B2B enterprise that wants to sync to its partners and customers without enduring the congestion of public peering [on a “shared fabric” or “peering fabric”, where multiple parties interconnect their networks at a single port] can establish private “cross-connects”, or cables that directly tether its equipment to that of its customers within the same DC [in an intracampus cross connect, the DC operator connects multiple datacenters with fiber optic cables, giving customers access to customers located in other DC buildings].
[To get a sense of how consequential network peering is to experiencing the web as we know it today, here’s an account of a de-peering incident, as told by Andrew Blum in his book Tubes: Behind the Scenes at the Internet:
“In one famous de-peering episode in 2008, Sprint stopped peering with Cogent for three days. As a result, 3.3% of global Internet addresses ‘partitioned’, meaning they were cut off from the rest of the Internet…Any network that was ‘single-homed’ behind Sprint or Cogent – meaning they relied on the network exclusively to get to the rest of the Internet – was unable to reach any network that was ‘single-homed’ behind the other. Among the better-known ‘captives’ behind Sprint were the US Department of Justice, the Commonwealth of Massachusetts, and Northrop Grumman; behind Cogent were NASA, ING Canada, and the New York court system. Emails between the two camps couldn’t be delivered. Their websites appeared to be unavailable, the connection unable to be established.”]
The benefits of colocation seem obvious enough. Even the $2mn+ of capital you’re laying out upfront for a small 10k sf private build [55]is a pittance compared to the recurring expenses – taxes, staff, and maintenance, and especially power – of operating it. You won’t get the latency benefits of cross-connecting with customers, you’ll pay costly networking tolls to local transit providers, and you’re probably not even going to be using all that built capacity most of the time anyhow.
There’s this theory in urban economics called “economies of agglomeration”, which posits that firms in related industries achieve scale economies by clustering together in a confined region, as the concentration of related companies attracts deep, specialized pools of labor and suppliers that can be accessed more cost effectively when they are together in one place, and results in technology and knowledge spillovers. For instance, the dense concentration of asset managers in Manhattan attracts newly minted MBAs looking for jobs, service providers scouring for clients, and management teams pitching debt and equity offerings. Analysts at these shops can easily and informally get together and share ideas. This set of knowledge and resources, in turn, compels asset managers to set up shop in Manhattan, reinforcing the feedback loop.
I think you see where I’m going with this. The day-to-day interactions that a business used to have with its suppliers, partners, and customers in physical space – trading securities, coordinating product development, placing an order, paying the bills – have been increasingly mapped onto a virtual landscape over the last several decades. Datacenters are the new cities. Equinix’s critical competitive advantage, what separates it from being a commodity lessor of power and space, resides in the network effects spawned by connectivity among a dense and diverse tenant base within its 180+ data centers. You might also cite the time and cost of permitting and constructing a datacenter as an entry barrier, and this might be a more valid one in Europe than in the US, but I think it’s largely besides the point. The real moat comes from convincing carriers to plug into your datacenter and spinning up an ecosystem of connecting networks on top.
The roots of this moat extend all the back to the late ’90s, when major telecom carriers embedded their network backbones into datacenters owned by Interxion, Telx [acquired by Digital Realty in October 2015], and Equinix, creating the conditions for network effects to blossom over the ensuing decade+: a customer will choose the interconnection exchange on which it can peer with many other relevant customers, partners, and service providers; carriers and service providers, in virtuous fashion, will connect to the exchange that supports a critical mass of content providers and enterprises. Furthermore, each incremental datacenter that Equinix or Interxion builds is both strengthened by and reinforces the existing web of connected participants in current datacenters on campus, creating what are known as “communities of interest” among related companies, like this (from Interxion):
[The bottom layer, the connectivity providers, used to comprise ~80% of INXN’s revenue in the early 2000s]
So, for instance, and I’m just making this up, inside an Interxion datacenter, Netflix can manage part of its content library and track user engagement by cross-connecting with AWS, and distribute that content with a high degree of reliability across Europe by syncing with any number of connectivity providers in the bottom layer. In major European financial centers, where Interxion’s datacenter campuses host financial services constituents, a broker who requires no/low latency trade execution and data feeds can, at little or no cost, cross-connect with trading venues and providers of market data who are located on the same Interxion campuses. Or consider all the parties involved in an electronic payments transaction, from processors to banks to application providers to wireless carriers, who must all trade traffic in real time. These ecosystems of mutually reinforcing entities have been fostered over nearly 20 years and are difficult to replicate. Customers rely on these datacenters for mission critical network access, making them very sticky, as is evidenced by Equnix’s MRR churn rate of ~2%-2.5%.
[Here’s a cool visual from Equinix’s Analyst Day that shows how dramatically its Chicago metro’s cross-connects have proliferated over the last 6 years, testifying to the network effects at play. Note how thick the fibers on the “Network” cell wall are. Connectivity providers are the key.]
The carrier-rich retail colocation datacenters that I refer to in this post differ from their more commodified “wholesale” cousins in that the latter cater to large enterprises that lease entire facilities, design and construct their architectures, and employ their own technical support staff. Retail datacenters with internet exchanges, meanwhile, are occupied by smaller customers who lease by the cabinet, share pre-configured space with other customers, and rely on the DC’s staff for tech support. But most critically, because wholesale customers primarily use DCs for space and power rather than connectivity, they do not benefit from the same network effects that underpin the connectivity-rich colo moat. It is the aggregation function that gives rise to a fragmented customer base of enterprises, cloud and internet service providers, and system integrators (Equinix’s largest customer accounts for less than 3% of monthly recurring revenue) and allows the IX colo to persistently implement price hikes that at least keep up with inflation.
This is not the case for a wholesale DC provider, who relies on a few large enterprises that wield negotiating leverage over them. DuPont Fabros’ largest customer is over 25% of revenue; it’s second largest accounts for another 20%. A simple way to see the value differentiation between commodity wholesale and carrier-rich retail data center operators is to simply compare their returns on gross PP&E over time.
EBITDA / BoP Gross PPE
Avg
2011-2016
Wholesale
DuPont Fabros
9.0%
Digital Realty
10.1%
IX Retail
Equinix
16.7%
Interxion
15.1%
[There are also retail colos without internet exchange points that deliver more value for their customers than wholesale DCs but less compared to their IX retail brethren, and some DCs operate a hybrid wholesale/retail model as well. It’s a spectrum]
So you can see why wholesale DCs have been trying to break into the IX gambit organically, with little success, for years. Digital Realty, which today gets ~15% of its revenue from interconnection, bought its way into the space through its acquisition of Telx in October 2015, followed up by its acquisition of a portfolio of DCs from Equinix in July 2016. The secular demand drivers are many…I’m talking about all the trends that have been tirelessly discussed for the last several years: enterprise cloud computing, edge computing, mobile data, internet of things, e-commerce, streaming video content, big data. These phenomena are only moving in one direction. We all know this and agree.
But it’s not just about the amount of data that is generated and consumed, but also about how. The ever hastening pace and competitiveness of business demand that companies have access to applications on whatever device wherever they happen to be; the data generated from their consumption patterns and from the burgeoning thicket of IoT devices need to, in turn, be shot back to data center nodes for analysis and insight. And the transfer of data to and from end users and devices to the datacenters needs to happen quickly and cheaply. Today, the typical network topology looks something like this…
…a hub-and-spoke model where an application traverses great lengths from a core datacenter located somewhere in the sticks to reach end users and data is then backhauled from the end user back to the core. This is expensive, bandwidth-taxing, slow, and because it is pushed over the public internet, sometimes in technical violation of strict security and privacy protocols. You can imagine how much data a sensor-laden self-driving car generates every minute and how unacceptably long it would take and how expensive it would be to continuously transfer it all back to the core over a 4G network. Instead, the IT network should be reconfigured to instead look like this…
…a widely-distributed footprint of nodes close to end user/device, each node hosting a rich ecosystem of networks and cloud partners that other networks and cloud partners care about, pushing and pulling bits to and from users more securely and with far less latency vs. the hub/spoke configuration. Microsoft clearly shares the same vision. Satya Nadella on MSFT’s fiscal 4q conference call:
“So to me that’s what we are building to. It’s actually a big architectural shift from thinking purely of this as a migration to some public cloud to really thinking of this as a real future distributed computing infrastructure and applications…from a forward looking perspective I want us to be very, very clear that we anticipate the edge to be actually one of the more exciting parts of what’s happening with our infrastructure.”
Something to consider is that while distributed computing appears to offer tailwind for the IX colos, it can have existential whiffs when pushed to the extreme. Is it really the long-term secular trend that EQIX management unequivocally proclaims it to be? Or is it just a processing pit stop for workloads that are inexorably inching their way further to the edge, to be directly manipulated by increasingly intelligent devices?
Consider that this past summer, Microsoft released Azure IoT Edge, a Windows/Linux solution that enables in-device AI and analytics using the same code running in the cloud. To draw an example from Microsoft’s Build Developer conference, Sandvik Coromant, a Swedish manufacturer of cutting tools, already has machines on its factory floors that send telemetry to the Azure cloud, where machine learning is applied to the data to predict maintenance needs and trigger preemptive machine shutdowns when certain parameters are tripped. But with Azure IoT Edge, that logic, and a whole menu of others that used to reside solely in the cloud, can now be ported directly to the machines themselves. The process loop – sending telemetry from the device to the cloud, analyzing it, and shooting it back down to the device – is obviated, cutting the time to decommission a faulty machine from 2 seconds down to ~100 milliseconds. While this seems like the cloud node is rendered inert, note that the algorithms are still developed and tested in the data center before being exported to and executed on the device…and even as in-device local AI becomes more sophisticated, the data deluge from burgeoning end nodes will still need to be synced to a centralized processing repository to more intensively train machine learning algorithms and generate predictive insights that are more expansive than can be derived locally.
But there is also the fear that as enterprises consider moving workloads off-premise, they bypass hybrid [public + private colocated or on-premise cloud services] and host mostly or entirely with a public hyperscale vendor (AWS, Azure, Google Cloud) [a colocated enterprise brings and maintains its own equipment to the datacenter, whereas a public cloud customer uses the equipment of the cloud provider] or that current hybrid enterprises migrate more and more workloads to the public cloud…or that public cloud vendors build out their own network nodes to host hybrid enterprises. But by all accounts, Equinix is in deep, mutually beneficial partnership with Cloud & IT services customers (AWS, Google, Azure, Box, SaaS companies), who have been the most significant contributors to Equinix’s monthly recurring revenue (MRR) growth over the last several years. The hyperscalers are relying on connectivity-rich colos like Equinix and Interxion to serve as their network nodes to meet latency needs on the edge.
There are 50 or so undersea cable initiatives in the world today that are being constructed to meet the proliferating amount of cross-border internet traffic, which has grown by 45x over the last decade. These subsea projects are being funded not by telecom networks as in days past, but by the major public cloud vendors and Facebook, who are landing many of those cables directly on third party interconnection-rich colos that host their web services.
[Source: TeleGeography]
Cloud & IT customers comprise half the Equinix’s top 10 customers by monthly recurring revenue (MRR), operate across all three of the company’s regions (America, EMEA, and APAC) in, on average, 40 of its datacenters [compared to 4 of the top 10 operating in fewer than 30 datacenters, on average, just a year ago]. The number of customers and deployments on Equinix’s Performance Hub, where enterprises can cross-connect to the public clouds and operate their private cloud in hybrid fashion, has grown by 2x-3x since 1q15, while 50%+ growth in cross-connects to cloud services has underpinned 20% and 14% recurring revenue CAGRs for Enteprise and Cloud customers, respectively, over the last 3 years.
Still another possible risk factor was trumpeted with great fanfare during CNBC’s Delivering Alpha conference last month by Social Capital’s Chamath Palihapitiya, who claimed that Google was developing a chip that could run half of its computing on 10% of the silicon, leading him to conclude that: “We can literally take a rack of servers that can basically replace seven or eight data centers and park it, drive it in an RV and park it beside a data center. Plug it into some air conditioning and power and it will take those data centers out of business.”
While this sounds like your standard casually provocative and contrived sound-bite from yet another SV thought leader, it was taken seriously enough to spark a sell-off in data center stocks and put the management teams of those companies on defense, with Digital Realty’s head of IR remarking to Data Center Knowledge:
“Andy Power and I are in New York, meeting with our largest institutional investors, and this topic has come up as basically the first question every single meeting.”
To state the obvious, when evaluating an existential claim that is predicated upon extrapolating a current trend, it’s often worth asking whether there is evidence of said trend’s impact today. For instance, the assertion that “intensifying e-commerce adoption will drive huge swaths of malls into extinction”, while bold, is at least hinted at by moribund foot traffic at malls and negative comps at mall-based specialty retailers over the last several years. Similarly, if it is indeed true that greater chip processing efficiency will dramatically reduce data center tenancy, it seems we should already be seeing this in the data, as Moore’s law has reliably held since it was first articulated in the 1970s, and server chips are far denser and more powerful today than they were 5-10 years ago. And yet, we see just the opposite.
Facebook, Microsoft, Alphabet, and Amazon are all accelerating their investments in datacenters in the coming years – opening new ones, expanding existing ones – and entering into long-term lease agreements with both wholesale and connectivity colo datacenter operators. Even as colocation operators have poured substantial sums into growth capex, utilization rates have trekked higher. Unit sales of Intel’s datacenter chips have increased by high-single digits per year over the last several years, suggesting that the neural networking chips that CP referred to are working alongside CPU servers, not replacing them.
It seems a core assumption to CP’s argument is that the amount of data generated and consumed is invariant to efficiency gains in computing. But cases to the contrary – where efficiency gains, in reducing the cost of consumption, have actually spurred more consumption and nullified the energy savings – are prevalent enough in the history of technological progress that they go by a name, “Jevons paradox”, described in this The New Yorker article from December 2010[56]:
In a paper published in 1998, the Yale economist William D. Nordhaus estimated the cost of lighting throughout human history. An ancient Babylonian, he calculated, needed to work more than forty-one hours to acquire enough lamp oil to provide a thousand lumen-hours of light—the equivalent of a seventy-five-watt incandescent bulb burning for about an hour. Thirty-five hundred years later, a contemporary of Thomas Jefferson’s could buy the same amount of illumination, in the form of tallow candles, by working for about five hours and twenty minutes. By 1992, an average American, with access to compact fluorescents, could do the same in less than half a second. Increasing the energy efficiency of illumination is nothing new; improved lighting has been “a lunch you’re paid to eat” ever since humans upgraded from cave fires (fifty-eight hours of labor for our early Stone Age ancestors). Yet our efficiency gains haven’t reduced the energy we expend on illumination or shrunk our energy consumption over all. On the contrary, we now generate light so extravagantly that darkness itself is spoken of as an endangered natural resource.
Modern air-conditioners, like modern refrigerators, are vastly more energy efficient than their mid-twentieth-century predecessors—in both cases, partly because of tighter standards established by the Department of Energy. But that efficiency has driven down their cost of operation, and manufacturing efficiencies and market growth have driven down the cost of production, to such an extent that the ownership percentage of 1960 has now flipped: by 2005, according to the Energy Information Administration, eighty-four per cent of all U.S. homes had air-conditioning, and most of it was central. Stan Cox, who is the author of the recent book “Losing Our Cool,” told me that, between 1993 and 2005, “the energy efficiency of residential air-conditioning equipment improved twenty-eight per cent, but energy consumption for A.C. by the average air-conditioned household rose thirty-seven per cent.”
And the “paradox” certainly seems apparent in the case of server capacity and processing speed, where advances have continuously accommodated ever growing use cases that have sparked growth in overall power consumption. It’s true that GPUs are far more energy efficient to run than CPUs on a per instruction basis, but these chips are enabling far more incremental workloads than were possible before, not simply usurping a fixed quantum of work that was previously being handled by CPUs.
With all this talk around chip speed, it’s easy to forget that the core value proposition offered by connectivity-rich colos like EQIX and INXN is not processing power but rather seamless connectivity to a variety of relevant networks, service providers, customers, and partners in a securely monitored facility with unimpeachable reliability. When you walk into an Equinix datacenter, you don’t see infinity rooms of servers training machine learning algorithms and hosting streaming sites, but rather cabinets housing huge pieces of switching equipment syncing different networks, and overhead cable trays secured to the ceiling, shielding thousands of different cross-connects.
The importance of connectivity means that the number of connectivity-rich datacenters will trend towards but never converge to a number that optimizes for scale economies alone. A distributed topology with multiple datacenter per region, as discussed in this post and outlined in this article[57], addresses several problems, including the huge left tail consequences of a single point of failure, the exorbitant cost of interconnect in regions with inefficient last-mile networks, latency, and jurisdictional mandates, especially in Europe, that require local data to remain within geographic borders. Faster chips do not solve any of these problems.
Incremental returns
An IX data center operator leases property for 10+ years and enters into 3-5 year contracts embedded with 2%-5% price escalators with customers who pay monthly fees for rent, power, and interconnection fees that comprise ~95% of total revenue. A typical new build can get to be ~80% utilized within 2-5 years and cash flow breakeven inside of 12 months. During the first two years or so after a datacenter opens, the vast majority of recurring revenue comes from rent. But as the datacenter fills up with customers and those customers drag more and more of their workloads to the colo and connect with other customers within the same datacenter and across datacenters on the same campus, power and cross-connects represent an ever growing mix of revenue such that in 4-5 years time, they come to comprise the majority of revenue per colo and user.
The cash costs at an Equinix datacenter break down like this:
% of cash operating costs at the datacenter:
Utilities: 35%
Labor: 19%
Rent: 15%
Repairs/Maintenance: 8%
Other: 23%
So, roughly half of the costs – labor, rent, repairs, ~half of “other” – are fixed.
If you include the cash operating costs below the gross profit line [cost of revenue basically represents costs at the datacenter level: rental payments, electricity and bandwidth costs, IBX data center employee salaries (including stock comp), repairs, maintenance, security services.], the consolidated cost structure breaks down like this:
% of cash operating costs of EQIX / % of revenue / mostly fixed or variable in the short-term?
With ~2/3 of EQIX’s cost structure practically fixed, there’s meaningful operating leverage as datacenters fill up and bustle with activity. Among Equinix’s 150 IBX datacenters (that is, datacenters with ecosystems of businesses, networks, and service providers), 99 are “stabilized” assets that began operating before 1/1/2016 and are 83% leased up. There is $5.7bn in gross PP&E tied up in those datacenters which are generating $1.6bn in cash profit after datacenter level stock comp and maintenance capex (~4% of revenue), translating into a 28% pre-tax unlevered return on capital.
Equinix is by far the largest player in an increasingly consolidated industry. It got that way through a fairly even combination of growth capex and M&A. The commercial logic to mergers in this space comes not just from cross-selling IX space across a non-overlapping customer base and taking out redundant SG&A, but also in fusing the ecosystems of datacenters located within the same campus or metro, further reinforcing network effects. For instance, through its acquisition Telecity, Equinix got a bunch of datacenters that were adjacent to its own within Paris, London, Amsterdam, and Frankfurt. By linking communities across datacenters within the same metros, Equinix is driving greater utilization across the metro as a whole.
While Equinix’s 14% share of the global retail colo + IX market is greater than 2x its next closest peer, if you isolate interconnection colo (the good stuff), the company’s global share is more like 60%-70%. Furthermore, according to management, half of the next six largest players in below chart are looking to divest their colocation assets, and of the remaining three, two serve a single region and one is mostly a wholesale.
Equinix points to its global footprint as a key competitive advantage, but it’s important to qualify this claim, as too many companies casually and erroneously point to their “global” presence as a moat. By being spread across multiple continents, you can leverage overhead cost somewhat, offer multi-region bundled pricing to customers, and point to your bigness and brand during the sales process. Equinix claims that around 85% of its customers reside in multiple metros and 58% in all three regions (Americas, EMEA, APAC)…but a lot of these multi-region relationships were simply manufactured through acquisition and in any case, the presence of one customer in multiple datacenters doesn’t really answer the question that really matters, which is this: does having a connectivity-rich colo in, say, New York City make it more likely that a customer will choose your colo in, say, Paris (and vice-versa) over a peer who is regionally better positioned and has a superior ecosystem? I don’t see why it would. I’m not saying that a global presence is irrelevant, just that housing the customer in one region does not make him inherently captive to you in another. A customer’s choice of datacenter will primarily be dictated by regional location, connectivity, ecosystem density, and of course, reliability and security.
Which is why I wouldn’t be so quick to conclude that Equinix, by virtue of its global girth, wields an inherent advantage over Interxion, another fine connecity-rich that gets all its revenue from Europe. Over the years, INXN has been a popular “play” among eventy types hoping for either a multiple re-rating on a potential REIT conversion or thinking that, as a $3.6bn market cap peon next to an acquisitive $36bn EQIX, the company could get bought. But the company has its fundamental, standalone charms too.
The European colos appear to have learned their lesson from being burned by overexpansion in the early 2000s, and have been careful to let demand drive high-single digit supply growth over the last decade. As tirelessly expounded in this post, replicating a carrier rich colo from scratch is a near insuperable feat, attesting to why there have been no new significant organic entrants in the pan-European IX data center market for the last 15 years and why customers are incredibly sticky even in the face of persistent price hikes. European colos are also riding the same secular tailwinds propelling the US market – low latency and high connectivity requirements by B2B cloud and content platforms – though with a ~1-2 year lag.
The combination of favorable supply/demand balance, strong barriers to entry, and a secularly growing demand drivers =
The near entirety of INXN’s growth has been organic too.
Compared to Equinix, Interxion earns somewhat lower returns on gross capital on mature data centers, low-20s vs. ~30%. I suspect that part of this could be due to the fact that Interxion does not directly benefit from high margin interconnection revenues to the same degree as Equinix. Interconnect only constitutes 8% of EQIX’s recurring revenue in EMEA vs. nearly 25% in the US. And cross-connecting in Europe has historically been free or available for a one time fee collected by the colo (although this service is transitioning towards a recurring monthly payment model, which is the status quo in the US).
[INXN has invested over €1bn in infrastructure, land, and equipment to build out the 34 fully data centers it operated at the start of 2016. Today, with 82% of 900k+ square feet utilized, these data centers generate nearly ~€370mn in revenue and ~€240mn in discretionary cash flow [gross profit less maintenance capex] to the company, a 23% annual pre-tax cash return on investment [up from mid-teens 4 years ago] that will improve further as recurring revenue accretes by high-single digits annually on price increases, capacity utilization, cross-connects, and power consumption.]
But in any case, the returns on incremental datacenter investment are certainly lofty enough to want to avoid the dividend drain that would attend REIT conversion. Why convert when you can take all your operating cash flow, add a dollop of leverage, and invest it all in projects earning 20%+ returns at scale? As management recently put it:
“…the idea of sort of being more tactical and as you described sort of let – taking some of that capital and paying a little bit of dividend, to me, that doesn’t smack of actually securing long-term, sustainable shareholder returns.”
Equinix, on the other hand, must at a minimum pay out ~half its AFFO in dividends, constraining the company’s organic capacity to reinvest, forcing it to persistently issuing debt and stock to fund growth capex and M&A. Not that EQIX’s operating model – reinvesting half its AFFO, responsibly levering up, earning ~30% incremental returns, and delevering over time – has shareholders hurting.
And there’s still a pretty long runway ahead, for both companies. Today’s retail colocation and interconnection TAM is around $23bn, split between carrier neutral colos at ~$15bn and bandwidth providers at ~$8bn, the latter growing by ~2%, the former by ~8%. Equinix’s prediction is that the 8% growth will be juiced a few points by enterprises increasingly adopting hybrid clouds, so call it 10% organic revenue growth, which would be slower than either company has registered the last 5 years. Layer in the operating leverage and we’re probably talking about low/mid-teens maintenance free cash flow growth.
At 28x AFFO/mFCFE, EQIX and INXN are not statistically cheap stocks. But it’s no so easy to find companies protected by formidable moats with credible opportunities to reinvest capital at 20%-30% returns for many years. By comparison, a deep-moater like VRSK[58] is trading at over 30x free cash flow, growing top-line by mid/high single digits, and reinvesting nearly all its prodigious incremental cash flow in share buybacks and gems like Wood Mac and Argus that are unlikely to earn anywhere near those returns.
Notes
INXN claims to be the largest pan-European player in the market, which is technically true but also a bit misleading because in the big 4 European markets (France, Germany, Netherlands, and the UK) that constitute 65% of its business, by my estimate, Interxion still generates less than 1/3 the revenue of Equinix. Even before the Telecity acquisition in January 2016, EQIX generated more EMEA revenue than Interxion, but now it has more datacenters and across more countries in the region too [well, depending on how you define “region” as the set of countries covered in Equinix’s EMEA is more expansive than that covered by Interxion].