Posted By
scuttleblurb
On
In
SAMPLE POSTS,[TRUP] Trupanion |
Comments Disabled
Looking at TRUP is like staring at one of those ambiguous images that could be both a rabbit and a duck, both a saxophonist and a woman’s face: we know that this is an insurance company, but we’re compelled to analyze it as a data-driven subscription service.
Of course, all responsible insurers are data-driven and the recurring nature of premiums also make them subscription-like, but we don’t typically think of insurers as a subscription service in the same vein as a SaaS enterprise. We do for TRUP largely because its management team has diligently trained us to focus on SaaSy metrics. Some of this is just reframing vocabulary: “subscription fees” not “premiums”, “members” not “policyholders”, “Territory Partners” not “agents”.. Trupanion’s ignorance of the insurance industry lexicon – scarcely a mention of reserves, underwriting leverage, medical cost trends, book value – is so obtrusive as to almost certainly be by design (what fast-growing enterprise wants to be seen as a boring insurance company?).
But this is also the first insurer I’ve see that disaggregates retention by member cohort and discloses lifetime value to customer acquisition cost ratios. That’s not a knock on the company. The first principle to any recurring, subscription-like model, insurance company or not, is onboarding customers for far less money than those customers will generate in lifetime profits. With most of the stuff you buy – a haircut, an iPhone – there is little confusion about the value of the product to you. Insurance is a lot squishier because you don’t know at the time of purchase whether you’ll need it. For major categories of insurance – where the covered thing is monetarily significant and its cost readily determinable, as in the case of a car or house, or where it transcends monetary value, as in the case of your family’s health – we easily buy into the collective understanding that in any given year, the premiums from those on whom fortune smiles subsidize those on whom she frowns. We don’t feel like our rights are being trammeled when law mandates we buy such insurance or that we’re being bamboozled when our insurer earns an underwriting profit from this scheme. We’re risk averse and understand that peace of mind is worth paying for and that an insurer should be compensated for giving it to us. But dogs and cats?
While there’s no question that we treat our pets far more humanely than we used to and that pets have graduated from the status of mere property, they still don’t occupy the same sanctified hemisphere as humans and we’re far from consensus on the range of seriously unfortunate health outcomes that we should be willing to prepare for. If you ask your friends about pet medical insurance, as I did, you’ll likely find that only a few have it, maybe half think it a reasonable purchase and the rest may outright scoff. Rather than pay $50 for a Trupanion policy with a 10% deductible, why not just put $40 in the cookie car every month as a sort of pet health savings account? If I’m shelling out $600 this year for a Trupanion policy and eat 10% of the costs, I need to think there’s a 20% chance of at least $6,000 in medical emergencies in the next 12 months for the policy to be “worth it”. [to put that in context, treating hip dysplasia for a Golden Retriever can cost anywhere between $2,000 (if diagnosed early) and $5,000 (if diagnosed late and a hip replacement is required)].
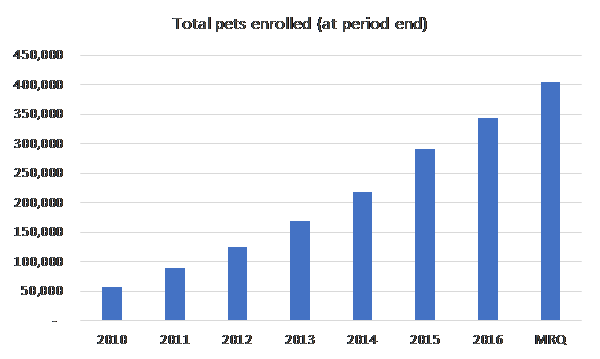
Of course, the decision to purchase insurance can be an emotional one that goes beyond sterile expected value calculations, and the more importance you place on your pet’s life and comfort, the less willing you are to roll the dice…but the point is that on the surface, it’s not entirely clear to me pet owners feel they need insurance for their pets. But can they be made to think they need it? There’s some evidence to believe that they can: the number of pets covered by Trupanion has compounded by 25%/year since 2011 to over ~360k and nearly 85% of members renew their policies every year…and half the lost profits of those who don’t renew are offset by existing members who insure more pets or refer their friends. The proselytizing efforts begin with the 40,000+ vets staffed at the 28,000 vet hospitals across North America (20,000 of which are independently owned and operated) who deliver ~54% of TRUP’s new members and from whom pet owners seek trustworthy guidance. [According this recent Motley Fool interview[1], Trupanion’s CEO claims that when vets recommend Trupanion to their clients, 1 in 4 people enroll.]
Sometimes oblique coverage restrictions, annual payout caps and long waiting periods for covered treatments are buried in fine print; other times, the insurance company and the vet charge based off different fee schedules, with the pet owner paying for the entire procedure out-of-pocket based the vet’s fee schedule only to be reimbursed weeks later by the insurance company using a lower “usual and customary” rate [which is based on fees charged by other physicians in the surrounding area for the same procedure]. A vet probably won’t be blamed for not proactively recommending pet medical insurance, but pushing a policy that culminates in an expensive “gotcha” moment is poison. Trupanion attacks these causes of friction and confusion by:
1/ pricing off the cost of care. Trupanion carefully estimates the cost of medical care across 1mn+ dimensions – species, breed, zip code, deductible, age – and simply tacks on 30% to arrive at the policy price paid by the pet owner…so, a pet owner is basically paying a 30% premium above expected medical costs to rid herself of cost uncertainty. Trupanion then pays out 90% of the vet’s invoice, with no limits per claim or illness. So, it doesn’t matter if one vet charges $2,000 and a rival vet across the street charges $1,000; Trupanion will cover 90% of the eligible treatment cost in both cases. Assuming Trupanion has accurately estimated the cost of care, in aggregate, 70c of every premium dollar Trupanion collects goes to paying vet invoices;
and
2/ re-directing reimbursement flow (in progress). With traditional pet insurance, the patient covers the entire vet invoice upfront and then hopes the check that arrives from the insurer in 2 weeks will reimburse her for the “right” amount. While most of Trupanion’s claims are still paid via check, they are increasingly routed through Trupanion Express, in which Trupanion pays the vet 90% of the bill directly, thereby taking the burden of up-front payment away from the consumer. Express can be integrated into practice management software so that an invoice is immediately shot over to Trupanion, who wires the requested funds into the vet’s bank account in less than 5 minutes. The number of vet hospitals with Express installed has grown from 89 in mid-2014 to 500 in 2015 to ~1,300 today, with over 30% of vet invoice dollars channeled through Express, on its way to 95%+. No other competitor in the space is even bothering to pursue a similar direct payment scheme.
These two changes largely lift the confusion attending discrepant pricing schedules and alleviate the strain of what in some cases could be an enormous immediate upfront payment for the pet owner, followed by an anxiety-ridden reimbursement interval. The member knows his out-of-pocket burden from the get-go and will not be financially surprised down the line. And because a Trupanion member need not wrestle with the financial uncertainty of costly medical care, she spends twice as much on vet services over her pet’s life than an uninsured pet owner…and the vet can simply focus on recommending the best treatment, without also stressing over the owner’s ability to pay.
Even so, considering the history of disappointing experiences with pet medical insurance, it’s no wonder that winning over vets has proven a laborious process. It can take 3-5 visits for a Territory Rep to even get her first meeting…so, if the TR is making 1 visit every 6 months, we’re talking years. Trupanion makes close to 100,000 face-to-face vet visits every year, with 200 hospitals per territory visited every 60 days (with touch frequency now increasing with impending account manager build out), and even after hammering away at vet conversion for nearly a decade in the US, the company still has significant work ahead: against a universe of 25,000 addressable hospitals in the US, only 8,100 are actively recommending Trupanion today, a figure that is growing by ~500-600 hospitals/year. Competitors, on the other hand, continue to take a direct-to-consumer approach, carpet bombing their territories with online marketing to create awareness, which in the absence of vet buy-in has not proven very effective.
Building trust is a time consuming process that requires TRs to persistently contact vets, who must then observe positive customer experiences firsthand. These relationships cannot be bought, but must be earned over time: a vet hospital will not compromise a pet owner’s continuing business for referral fees and besides, Trupanion does not offer kickbacks of any kind to vets for referring patients. You may be surprised to know that with the exception of VPI Nationwide, the largest player in the space with 40% share (vs. #2 Trupanion with 20%), other competitors like Healthy Paws and Pet Plan don’t underwrite the policies they sell. Trupanion’s conceit is that by owning all links in the chain – from sales to underwriting to claims processing to customer service – and forgoing reinsurance, it can provide insurance at a ~20% lower cost than peers. These savings are used to cover a greater proportion of claims costs – 70% of premiums at Trupanion vs. closer to 50% for peers – enabling a “no-fuss” payments experience that induces greater satisfaction from pet owners (who remain Trupanion members for longer) and buy-in from vets (who feel comfortable enough to recommend Trupanion to new clients).
Of course, sustainably profiting off a cost-plus model and credibly delivering on the promise to immediately cover 90% of whatever invoice requires precise, granular insight into the cost of pet acquisition and medical care. Over 17 years since inception, with data from 1.5mn+ claims and over 500,000 invoices/year, Trupanion has amassed cost and retention experience across 1mn+ category permutations…so, for instance, the company understands how the claims experience of a 5-year old bulldog in zip code 11201 differs from that of a 3-year old Shih Tzu in 60047 and can price the two pets accordingly. There are no short cuts to this process. The time required to build claims experience and flesh out statistically significant patterns at such a granular level is a steep learning curve that even a well-funded competitor cannot easily surmount. Although VPI Nationwide has been around longer than Trupanion, their dataset is less robust because they don’t price their policies with nearly as many observations (zip code, for instance) as Trupanion, nor do they cover congenital and hereditary conditions. [to be clear, Trupanion doesn’t cover pre-existing conditions either, but unlike other insurers, it doesn’t refuse coverage on all future illnesses arising because of pre-existing conditions].
Still, while data may be a competitive advantage in the early stages of penetrating a market niche, I’m not sure this in itself constitutes a real moat. Data has to be proprietary, valuable, and part of a self-reinforcing process (data network effects) for it to count as a sustainable edge. There’s a reason why you never hear insurers tout data as a unique advantage…there are diminishing returns to data as the relationship between price and insured risk doesn’t change all that much for granular exposures and eventually becomes common knowledge.
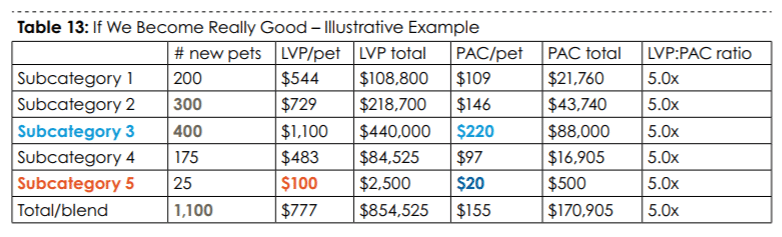
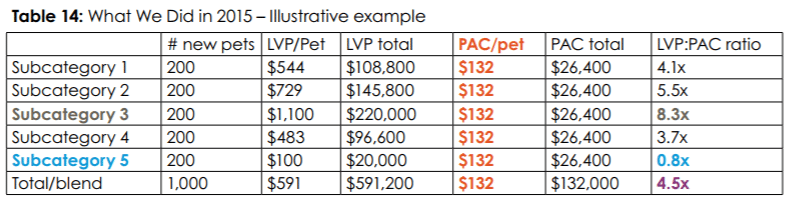
(the Lifetime Value of a Pet (LVP) to Pet Acquisition Cost (PAC) ratio that Trupanion reports every quarter is the blended output of explicit LVP:PAC targets across a slew of subcategories. So, while the lifetime value of, say, a 2-year old cat in Manhattan with a $1,000 deductible will differ from bulldog puppy in Pittsburgh with no deductible, Trupanion can toggle pricing and acquisition spend to get iteratively closer to a common IRR across subcategories, with no cross-subsidization between them. Ideally, the table would look something like this…
Not. quite. there. yet…
…
(Tables 13 & 14 from Trupanion’s 2016 Annual Letter)]
Meager pet insurance adoption rate in North America (< 2% of ~180mn dogs and cats) compared to certain Western European countries (25% in the UK, 50% in Sweden), is an oft-touted part of the bull case. Of course, one wonders why, when pet insurance has been available in America since at least the mid-80s, the disparity exists in the first place? I don’t really know. But one reasonable-sounding explanation I’ve heard is that in Western Europe, pet insurers launched by first winning over vets and those vets then pushed the product to consumers…whereas in the US, insurers started by asking “what price will pet owners pay for this thing called ‘pet insurance’?” and then reverse engineered a product without consulting the vets, yielding something that both consumers and vets hated.
In any case, it doesn’t really matter. I think we just want to see that the method to driving category adoption is sound. In an embryonic market, it’s up to pioneering companies to create the category. Pet medical insurance is so nascent in the US that although Trupanion continues to claim share – there are around 20 brands that make up the pet insurance space, but 2 players, VPI Nationwide and Trupanion, account for 60% of the insured pets – it does so in a market that, against the broader population of insurable pets, barely exists. Rather than look to foreign countries for cues, it seems better to just make a judgment call on whether a) the value proposition for vets makes sense, b) the company has the will and wherewithal to push the ball forward, and c) the product, when discovered and used by the end consumer, solves a real need (including a need the consumer previously didn’t even know she had). a) and c) are tied at the hip since, as previously discussed, vets will only pitch Trupanion if the pet owner perceives benefit. While I harbor doubts about the intrinsic value to a pet owner, those personal reservations are trumped by nearly a decade of data strongly supporting the claim that yes, pet insurance is becoming a thing in the US. As born out over many cohorts, the average life of a Trupanion member is around 6 years…
…during which period the company pulls 20c in variable profit from every incremental premium dollar, reinvesting most of that into acquiring new pets…
….at compelling lifetime values translating into huge IRRs, leveraging sales & marketing and fixed expenses along the way.
The IRR math works roughly as follows: on average, Trupanion pays $175 to acquire a pet and recognizes premiums of around $53 for that pet each month over 71 months. That 53 bucks is whittled away like so:
Monthly premium: $53
Vet invoices: ($37) [70% of the $50 premium]
Variable expenses: ($5)
Contribution profit: $11 [20% of premiums. The Lifetime Value of a Pet (LVP) is computed off this figure]
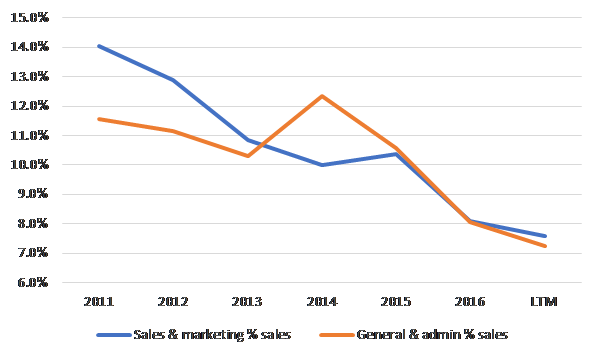
After adding back sales & marketing, Trupanion’s trailing 12 month EBITDA margin after stock-comp is ~8%, implying fixed costs of ~12% of premiums [20% contribution margins less 8% EBITDA margins ex. sales and marketing], so 60% of contribution profits are being consumed by fixed operating costs at the moment.
But at scale, which management pegs at ~700k pets (vs. over 360k today growing low/mid-teens y/y), the company thinks it can do 15% adjusted operating margins excluding the cost of adding new pets. When we back off 1%-2% for stock comp, it’s maybe more like 13%. Given the degree to which Trupanion has leveraged its cost structure over the last 6-7 years, I find this claim credible.
And so, at scale…. .
Fixed expenses: ($3)
Capital charge: ($0.6) [8% x (monthly premium divided into a premium:surplus ratio of 6x)]
Profit/pet/month: $7 [13% of premiums]
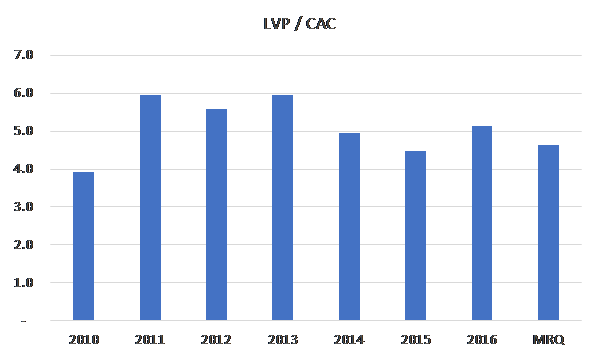
In other words, the company is generating ~$520 in profits over the average lifetime of a member, around 3x the cost to acquire that member. The cash flow streams over ~71 months impute a 65% IRR. Alternatively, at a 15% discount rate, the present value of cash flows over of a subscriber’s life is ~$330, nearly twice the cost of acquisition. Imputing attractive unit economics, of course, requires a sufficiently wide LVP-PAC spread. The $175 pet acquisition cost that I am using assumes the current LVP/CAC of 4.5x, where it has roughly been for the last 5-6 years. This figure would have to decay to below 2.5x before the NPV of pet acquisitions turns negative (i.e. destroys value).
But I see no reason to expect such a draconian deterioration and in fact, it’s possible that as the company further densifies its markets with vet allies, layering on radio and TV spend may even boost conversion from vet recommendations, as has been true thus far in Trupanion’s mature markets where half or more of vet hospitals actively recommend Trupanion.
Given the unit economics and the runway, it’s not hard to see how things can get interesting [though whether they can get interesting enough to buy the stock at today’s valuation is an entirely different question]. Assuming today’s annual PAC spending of ~$15mn/year grows by a few million per year and even assuming LTV/CAC deflates to below 4x, I can get to just over 800k enrolled pets in year-7, around 12% growth per annum. Absent some “silver bullet for cost effective accelerated organic growth” (company’s words), management seems determined to fund its expansion entirely with internally generated profits.
Applying a pre-PAC scale margin of 13% to implied revenue gets us to around $70mn in pro-forma EBITDA, which, assuming reinvestment, will be growing by low-teens, providing still more ammo for pet acquisition. With 800k enrolled pets against a universe of 180mn dogs and cats in North America, Trupanion will still not have even nicked the surface of its potential…so, still be plenty of opportunity to deploy maybe 40%-50% of pre-PAC EBITDA into onboarding pets at 40%+ IRRs. In theory at least. What you’ve just seen is the rabbit. But what about the duck?
After all, this is still an insurance company and balance sheet strength reigns paramount. But is it and does it? Trupanion’s underwriting leverage – premiums to surplus ratio, a measure of how much underwriting risk you are assuming relative to the capital you hold – is greater than 6x [Trupanion does not reinsure its risk, so subscriptions = gross premiums = net premiums]. Whether this exceeds the standard of prudence depends on the nature of risk being insured. Typically, a ratio greater than 3x is considered unusually aggressive for a P&C underwriter and an insurer with significant high-severity natural catastrophe exposure will keep it closer to 1x. Health insurers, in contrast, will underwrite 7x+ their surplus. In my experience, growth and conservative underwriting are hardly ever simultaneously executed well together, and if this were a run-of-the-mill P&C underwriter, Trupanion’s thin capital base would probably be reason alone to pass.
But I think Trupanion is a different animal. The risks covered under pet medical insurance are bite-sized and absent a major, widespread health contagion, uncorrelated. Agglomerating hundreds of thousands of claims results in a more predictable range of experiences from year-to-year at the population level than most traditional P&C exposures and with far less tail risk too. Given the highly granular, uncorrelated nature of the insured risks, catastrophe is a remote risk. The company’s exposures are also short-tailed, meaning that claims-triggering events are readily apparent and the costs from those events accurately estimable and paid soon thereafter: over 90% of the company’s reserves as of 3q17 are related to activities incurred in 2017 and close to 95% of claims paid over the last year was related to business underwritten in the same year. Only a miniscule amount of claims incurred and paid relate to prior years. [one negative consequence to premiums heading out the door to pay claims almost as soon as they come in is that Trupanion doesn’t benefit from “float” income as a typical insurer does].
Compare this to the “long-tail” risk of asbestos, where the health consequences from exposure remained latent for many years and claims were still being paid more than decade after policies were originally underwritten…that is, people were getting silently screwed by asbestos during the coverage period; the insurance companies didn’t know it at the time and so didn’t properly reserve for it.In contrast, the short-tail nature of Trupanion’s risk means that its best guess about claims cost and frequency is rapidly (in)validated and any deviations can be dynamically accommodated through price adjustments. While Trupanion won’t hike a member’s monthly subscription fee based on her pet’s individual medical condition, it will do so if the average cost of care for all pets within the same sub-category rises, so systematic pricing errors are quickly rectified. Steering the ship is 48-year old founder, CEO, and ~8% owner Darryl Rawlings, who has a good story about how his parents’ experience about not having the money to remedy a life-saving procedure for his childhood dog, prompted him to start Trupanion 10 years later (maybe too good a story?). In any case, I highly recommend reading his annual letters, which are refreshingly exorcised of hygienic corporate bullshit and lay out Trupanion’s operating strategy with a useful degree of granularity. Darryl seems authentically enthusiastic about this pet insurance mission and appears to “get” how value is created…it’s hard to imagine a diversified underwriter/bank/savings institution like Nationwide pursuing this opportunity with the same single-minded vigor.
[MCO – Moody’s] The Self-Reinforcing Standards Moat
Posted By
scuttleblurb
On
In
SAMPLE POSTS,[MCO] Moody's Corp |
Comments Disabled
Moody’s is a Nationally Recognized Statistical Rating Organizations (NRSROs), a title bestowed by the SEC on a handful of credit rating agencies, the top 3 of whom act as an oligopoly in the US debt ratings gambit. As you well know, Moody’s (and S&P and Fitch) fell into disrepute during the last financial crisis when its ratings on vast swaths of corporate and securitized paper proved worthless, its grossly conflicted issuer-pay model laid plainly bare. But testament to the company’s resilient business model, and toothless fines and regulatory censures notwithstanding, Moody’s Investor Service (“MIS”, the credit rating agency side of the business that constitutes ~2/3 of revenue and ~85% of EBITDA) has thrived since the crisis, compounding revenue and EBITDA by 10% and 15%, respectively, since 2009 and generating more of each vs. the 2007 peak:
MIS segment, $ millions
2007
2009
LTM
Revenue
1,780
1,218
2,550
EBITDA
1,021
543
1,555
% margin
57%
45%
61%
Over the last 100+ years since its founding, Moody’s ratings – derived from a consistent framework applied across 11k and 6k corporate and public finance issuers, respectively, in addition to 64k structured finance obligations – have become the veritable benchmark by which market participants, from investors to regulators, peg the credit worthiness of one debt security against another. NRSRO ratings underpin the risk weightings that banks attach to assets to determine capital requirements, dictate which securities a money market fund can own, and, in ostensibly surfacing the credit risk embedded in fixed income securities, make it easier for two parties to confidently price and trade, enhancing market liquidity. I was a research nerd in the bond group at Fidelity just prior to and during the crisis. It’s hard to overstate just how tightly Moody’s and S&P (and to a lesser degree, Fitch) ratings were stitched into the fabric of our ratings and compliance infrastructure and the day-to-day workflows of analysts and traders on the floor.
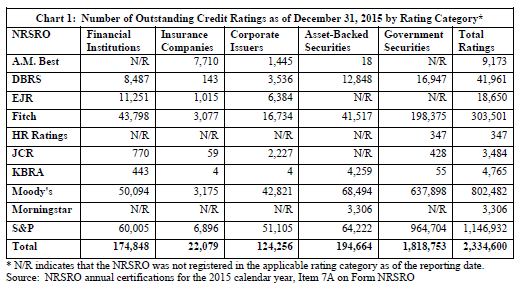
Because of such industry-wide adoption, a debt issuer has little choice but to pay Moody’s for a rating if it hopes to get a fair deal in the market: an issuer of $500mn in 10-year bonds might pay the company 6bps upfront ($300k), but will save 30bps in interest expense every year ($15mn over the life of the bond)….and each incremental issuer who pays the toll only further reinforces the Moody’s ratings as the standard upon which to coalesce, fostering still further participation. This feedback loop naturally evolves into a deeply entrenched oligopoly. In terms of total ratings issued, S&P and Moody’s are at the top of the heap. There are actually 10 NRSROs, but unless you work in credit, you’ve probably never heard of most of them (Egan Jones anyone?)
The government’s determination of NRSRO status is premised on “whether the rating agency is ‘nationally recognized’ in the United States as an issuer of credible and reliable ratings by the predominant users of securities ratings” (per this SEC report[2]), which criteria itself is in part tautologically attributable to the government’s NRSRO designation in the first place. And when things go horribly wrong and these ratings are shown to be the reactive measures that they are, the agencies simply appeal to freedom of speech protection under the First Amendment.
This is a really hard business to screw up. Who wants to rock the boat? Certainly not the staid management team at Moody’s, which thrives on 5 year plans, formulaic capital allocation policies, and farcically granular guidance that plays to the myopic expectations of sell-side model tweakers (though I give management props for expensing stock comp in its adjusted profit numbers). You will never see Moody’s carve out an “Other Bets” P&L for new innovations. Day One will always be yesterday. [If watching Sundar Pichai saunter on stage to fulsome fanboy applause against jubilant theme music from Fitz & The Tantrums provokes reflexive eye-rolling, then do yourself a favor…watch the 2016 Moody’s Investor Day webcast and take refuge in the sterile quietude of a generic albescent conference room where every cough and throat clear is awkwardly amplified against the AV projector’s fan’s sad whir.]
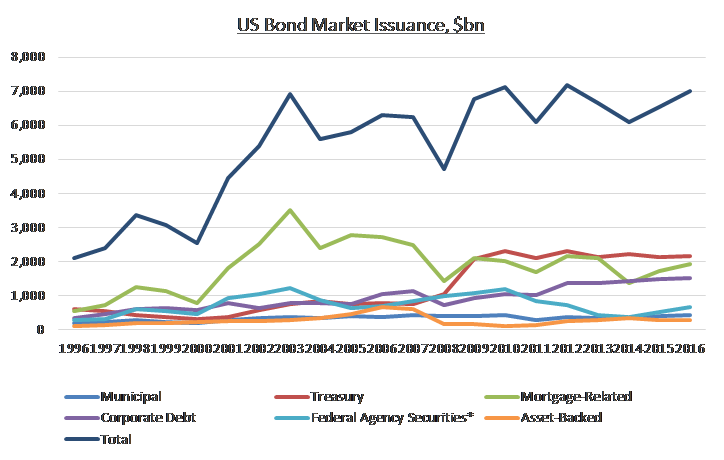
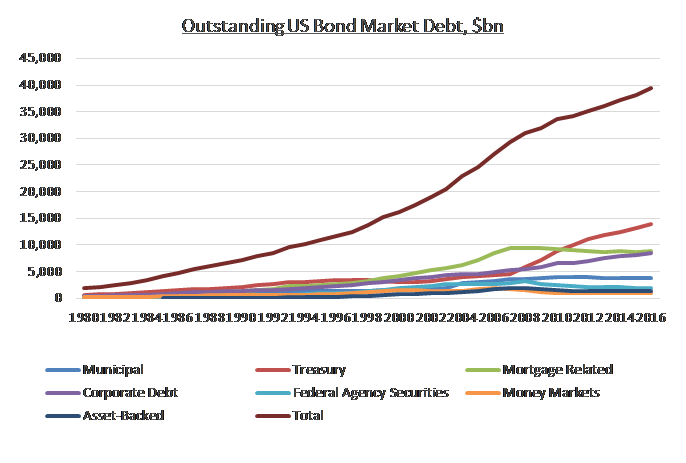
MIS’ 2016 revenue was about 60% transactional (tied to new debt issuance) and 40% “recurring” [per 10K: annual fee arrangements with frequent debt issuers, annual debt monitoring fees and annual fees from commercial paper and medium-term note programs, bank deposit ratings, insurance company financial strength ratings, mutual fund ratings], a mix that has been reasonably stable during the quiescent issuance environment of the last 5-6 years. Debt issuance in the US, which constitutes nearly 2/3 of MIS revenue, can be choppy from year-to-year….
Source: SIFMA
…but the overall stock of debt has been steadily growing…
Source: SIFMA
…so, as you might expect, MIS’ recurring revenue has served as a reliable anchor during stormy issuance periods.
MIS segment, $ millions
Revenue
Transactional
Recurring
2007
1,204
576
2008
591
614
2009
612
606
2010
800
605
2011
903
666
2012
1,173
714
2013
1,281
779
2014
1,372
875
2015
1,419
902
2016
1,430
930
LTM
1,616
934
Still, recurring profits did little to cushion the punishing issuance swoon during the last recession. Revenue from corporate and structured finance bond issuance declined 26% and 53%, respectively, from 2007 to 2008, forcing a ~$575mn revenue decline that translated into a $450mn EBITDA hit.
MIS segment, $ millions
Revenue*
EBITDA
2007
1,780
1,021
2008
1,205
632
2009
1,218
603
2010
1,405
685
2011
1,569
804
2012
1,887
991
2013
2,059
1,116
2014
2,248
1,277
2015
2,304
1,307
2016
2,340
1,255
LTM
2,550
1,555
* excludes a negligible amount of “other”
non-ratings revenue
We don’t know the profit split between transactional and recurring profits (and I don’t even know if such a determination is possible since labor is the biggest component of SG&A and allocating the cost of an analyst’s time between new issuance and maintenance work feels like arbitrary hair splitting). But, I think we can confidently say that non-recurring revenue per dollar of new issuance is way larger than recurring revenue pulled from each par dollar of the rated installed base, and so big swings in transactional revenue have a disproportionate impact on profitability…though, keep in mind that heavy debt issuance in a given period adds to the stock of outstanding debt and thus the monitoring fees earned in future periods.
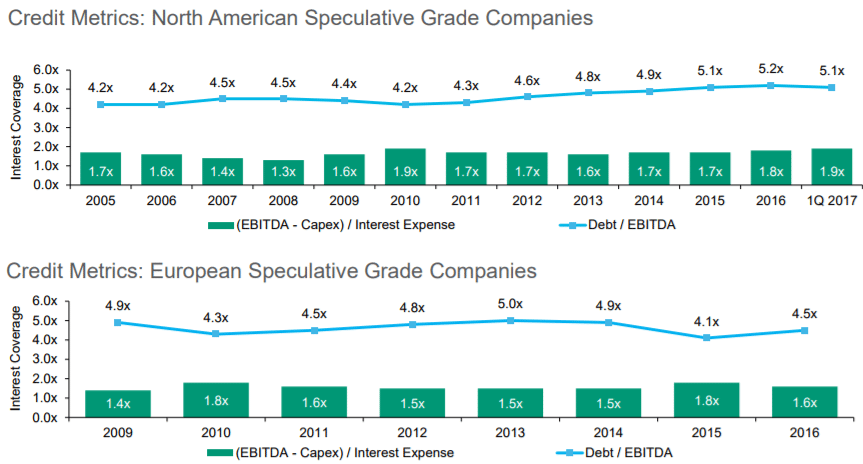
Given the lofty contribution margins attached to new issuance, the prospect of a reversal has been a source of trepidation for me. Transactional revenue growth has proceeded at a strong, though not torrid, 12% pace over the last 6-7 years as issuers have seized on a stubbornly low rate environment to refinance debt and add leverage to their balance sheets.
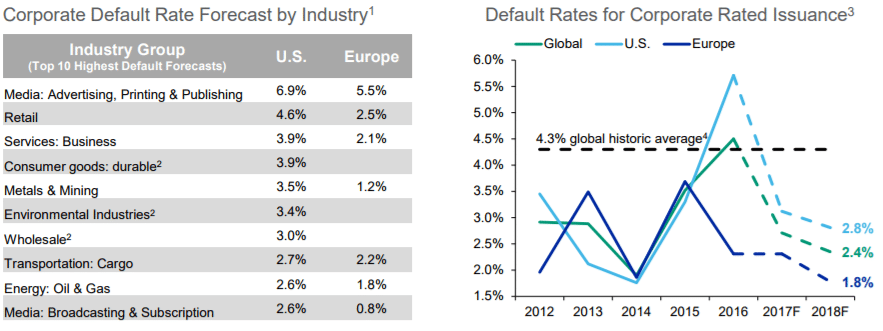
Meanwhile, outside a commodity-driven hiccup in 2016, high yield default rates are well below the historic average (which should give you pause if you believe in cycles and mean reversion).
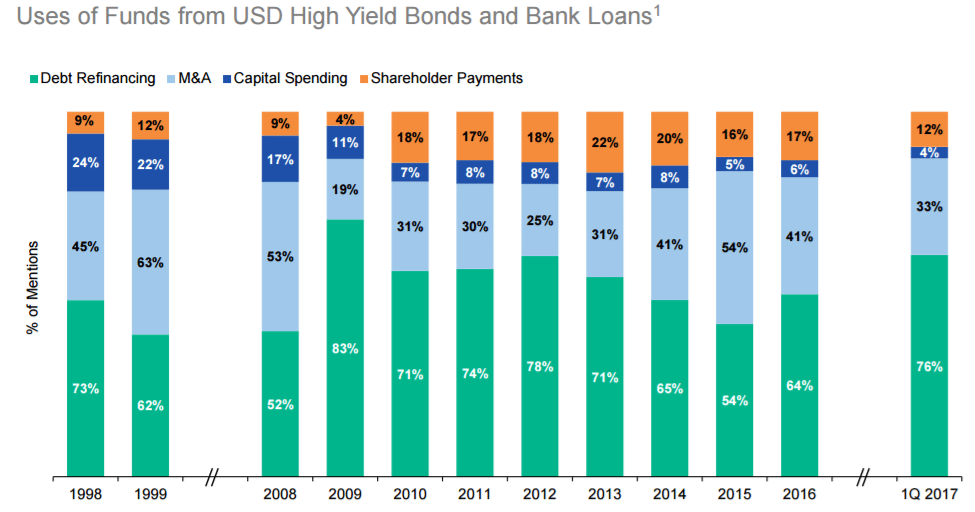
[Aside: the below exhibit, which breaks out the uses of funds from high yield bond and bank loans, is interesting in its own right. In the late 1990s, 20%-25% of companies that raised funds cited internal investment as a reason for doing so vs. just a mid-single/high-single digit percentage today.]
I’m being unhelpfully obvious when I say that credit conditions feel toppy. But even if mean reversion is impending, 2008/2009 seems an inappropriate analog since not only is the catalyst driving systemic financial concerns that loomed so large back then less relevant today, but also a significant chunk of the company’s pre-2008 profits came from its reckless rubber-stamping of toxic asset-backed securities.
(MIS revenue, $mn)
2007
2008
2009
2010
Structured Finance
868.4
404.7
304.9
290.8
% change
-0.5%
-53.4%
-24.7%
-4.6%
Non-Structured Finance
911.5
800.0
912.8
1,114.2
% change
18.8%
-12.2%
14.1%
22.1%
EBITDA
1,020.5
568.7
543.0
623.5
% change
4.8%
-44.3%
-4.5%
14.8%
Disaggregating MIS’ revenue streams per above, we see that outside of structured finance, the revenue declines were actually not sooo bad during the worst financial crisis in decades, thanks of course to issuance stoked by aggressive rate-deflating monetary policy measures. Structured finance grew from just $384mn in revenue in 2002 to $873mn in 2006 (an 18% CAGR) and was so profitable that even while non-SF revenue grew by 14% in 2009, overall MIS EBITDA still declined as SF revenue contracted by another 25% from 2008’s harrowing 53% decline. I don’t believe MIS has significant revenue streams tied to comparably negligent and profligate underwriting today, and would expect the profit hit from a cyclical correction to be far more muted.
Also, due to the surge in 7-10 year paper subsequent to the financial crisis – MIS’ non-structured revenue increased by 17%/yr from 2008 to 2012 – the refinancing needs over the next 4 year period (2017 to 2020) are 30% greater than they were from 2013 to 2016, providing an intermediate tailwind to transactional revenue, though 1h17’s whopping 30% y/y growth in corporate finance revs is clearly testament to some pull-forward of refinancing needs. Debt issuance cycle aside, companies have been increasingly tapping the capital markets, rather than banks, for their debt funding needs. In Europe, bonds constitute just 23% of non-financial debt [bonds + bank loans] outstanding vs. 52% in the US, with the mix shifting in favor of bonds over at least the last decade.
Management thinks that disintermediation (+2%-3%) plus debt issuance prompted by global GDP growth (+2%-3%) plus pricing (+3%-4%) should sum up to around ~high-single/low double digit revenue growth through the debt cycle, which sounds reasonable to me and is consistent with the 9% revenue CAGR MIS has realized since 2011. And on top of that, there’s another 2%-3% contribution from Moody’s Analytics, MCO’s less good business segment that offers a range of risk management, research, and data products and services, and constitutes about 1/3 of revenue and 16% of EBITDA (corporate overhead is already allocated to business segments). Almost all of the ~$1bn that the company has spent on acquisitions (out of cumulative free cash flow of ~$8bn) over the last decade through 1q17 has gone towards bolstering MA, mostly small tuck-ins.
Then, on May 15, 2017, management announced the €3bn acquisition of Bureau van Dijk. Moody’s is spending 3x more on this one acquisition than it has on the sum of all previous acquisitions over the last decade. BvD is an Amsterdam-based company that aggregates data on 220mn private companies across a wide range of geographies and industries and makes it available in hygienic, organized form to 6k corporate and government customers. This acquisition will be “tucked into” RD&A [In 2016, about 54% of MA’s revenue came from “Research, Data, and Analytics,” which is really just an extension of MIS insofar as it realizes revenue by selling research and data (analysis on debt issuers, economic commentary, quantitative risk scores, etc.) generated in MIS. The quality of RD&A mirrors that of the ratings segment, with 95% retention rates driving hsd revenue growth (90% organic) from hsd pricing and volume since 2011], boosting its revenue by ~43% (and contributing ~8% to MCO’s total revenue). BvD does not own the data, but rather licenses it from 160mn obscure data providers in various jurisdictions before “cleansing” and standardizing it for subscribers who use it to, for instance, better assess credit risk, conduct M&A due diligence, set transfer pricing reporting policies and docs for multinationals, and identify potential B2B sales leads.
Management claims that this business benefits from network effects, by which I assume they mean that the license fees BvD pays to suppliers are pegged to the number of users of that data and so more users compel more suppliers to make their data available to BvD, which in turn draws more users. Going off the high-level historical financials provided by Moody’s, BvD has performed like a truly kick-ass asset, with revenue expanding at a steady 9% CAGR (all organic) over the last decade, growing every year right through the recession, and EBITDA margins expanding from 39% in 2006 to 51% in 2016. But great assets go for great prices. MCO is paying a lofty 12x revenue and 23x EBITDA at a time when its own stock traded at “just” ~14x at the time of announcement. €3bn is triple what private equity firm EQT paid for BvD less than 3 years ago. One might argue that if we extrapolate the last decade’s 12% annual EBITDA growth out 5 years (which might actually be reasonable given the seemingly predictable, consistent nature of the business) and apply estimated out-year synergies ($40mn revenue / $40mn costs), we’re looking at €295mn in 2021 EBITDA, which puts the multiple at ~10x, but even management concedes that it is reaching on valuation and falling short of their typical 10% cash yield target on this one. The revenue synergies seem fairly modest (14% of revenue, 5 years out) and sensible on the surface. For various reasons BvD has found it difficult to break into the US market (unlike regions outside the US, financial data on private companies in the US is sparse…plus, BvD who?) and still derives 3/4 of its revenue from Europe.
Moody’s can bundle BvD’s datasets into MA’s analytics products and sell a more robust bundle to its US customer base. [Notably, MA already feeds BvD’s data into the loan origination solution it sells to financial institution clients and some MA customers already use BvD data to drive their credit models] and cross-sell MA products into BvD’s customer base. Finally, BvD’s dataset on smaller, private companies gives MIS the opportunity to provide credit ratings to the underserved SME market, though this seems like a more distant aim. [Here’s a high-level summary of Moody’s business mix post-BvD; MA gets a nice margin lift and its EBITDA increases from ~17% of consolidated to nearly 1/4.]
(MCO LTM + BvD 2016, $ millions)
MIS
MA
MA+BvD
Revenue
2,550
1,272
1,560
EBITDA
1,555
290
438
% margin
61%
23%
28%
Still, most of management’s justifications – the acquisition reduces the volatility of the ratings business, is accretive to per share earnings, accelerates growth forecasts, gets the company access to new revenue opportunities like transfer pricing and tax planning that have little to do with the core ratings business – have jack to do with value creation and reek of generic Wall Street pandering. And while BvD’s business seems good enough on its own merits that I don’t think the acquisition will be grossly value destructive, it’s tough to credibly claim that much incremental value has been added at this lofty purchase multiple.
Outside of RD&A, there are two other business lines: 1) Enterprise Risk Solutions (11% of post-BvD revenue; risk management software and services…basically, financial institutions use Moody’s tools to create credit, market, and operational risk tables and make them available to their regulators; has grown revenue by ~11% organically over the last 8 years) and 2) Professional Services (4% of post-BvD revenue; financial training and certification, mid-single digit organic revenue growth since 2008….seems like a pretty mediocre business, but one which management insists is an important entry point to the customer). Taken as a whole, Moody’s Analytics is just “meh” compared to other data and analytics peers, in my opinon. Great analytics businesses tend to have self-reinforcing data feedback loops, which are not very relevant to MA.
[Here is what I wrote about Verisk: The company sits at the center of a network that procures data from a wide variety of sources on one side (claims settlements, remote imagery, auto OEMs, name your buzz word – smart cars, smart watches, smart cities) analyzes it, and spits out predictive risk and customer insights to their clients on the other (insurers, advertisers, property managers). The agreements through which a customer licenses VRSK’s data also allows the company to make use of that customer’s data, so essentially the customer pays Verisk for a solution that costs almost nothing for the company to deliver and Verisk gets to use that customer’s data to bolster the appeal of its own products, which improved solutions reduce churn and attract even more customers (and their data) in a subsidized feedback loop.]
Its solutions seem more akin to templated reporting and risk management to sate regulatory requirements than data-fueled machine learning algorithms to drive business outcomes. Management continuously talks about realizing synergies from tuck-ins and driving operating leverage, but the fact of the matter is that MA margins have gone nowhere for years and I think it’s fair to say that this side of the company has disappointed expectations. So, stepping back…nearly 80% of MCO’s pro-forma EBITDA comes from a ratings business that has long established itself as the de facto credit risk benchmark, relied upon by all significant players in the fixed income ecosystem. But while MIS is a structurally advantaged business that will continue heaping value over time, because 60% of MIS is high-margin transactional revenue tied to new issuance, it is also unavoidably cyclical, and conditions today seem about as good as they will get. Through the cycle, MIS is a steady high-single digit revenue / low-double-digit EBITDA grower generating prodigious free cash flow (30% of revenue converts to free cash flow). Most of it will be mechanically dedicated to buybacks and dividends, which is probably just as well since its tuck-in acquisitions have had little to show, and I suspect the same will be true of BvD. At $134, the stock trades at 18x/23x my estimate of pro-forma LTM EBITDA/cash EPS. The EBITDA multiple is about as high as it has been in decades (matched only in late 2005/early 2006) on what in retrospect will likely turn out to be cyclically peak earnings. Moody’s is a great business and is priced accordingly, though with a long enough time frame, a buyer will probably do just fine even at the current valuation.
[CPRT – Copart; KAR – KAR Auction Services] Copart is a Beast + Impending IAA Spin-Off from KAR
Posted By
scuttleblurb
On
In
SAMPLE POSTS,[CPRT] Copart,[KAR] KAR Auction Services |
Comments Disabled
Beneath the bustle of a used car lot lies a swarm of activity that few of us have ever seen, a thriving ecosystem of wholesalers, rebuilders, parts recyclers, insurers, and intermediators whose trading activities usher some vehicles to dealer lots for resale and others to repair shops or salvage auctions. Roughly 45mn used cars are sold in the US every year. 10mn+ of those are consumer-to-consumer private transactions that take place on eBay, Craigslist, and the like. The other ~30mn+ are captured by a fragmented base of over 40k used car dealerships (CarMax, Penske, Asbury, etc.) strewn across the country, 10mn of which are sourced through wholesale auctions…so, you might trade in your Chevy Bolt for a new Toyota Camry, but that Toyota dealer doesn’t want a Chevy sitting on the lot and so will sell that trade-in at a wholesale auction, through which the vehicle will find its way to a GM dealer. This being an auction market with two-sided network effects, wherein buyers attract sellers and sellers attract buyers, you will not be surprised to learn that value lopsidedly accrues to just two companies – KAR Auction Services, through its ADESA subsidiary, and Cox, through its Manheim subsidiary – who together process ~70%-75% of the market. This is not the only oligopoly in the auto value chain.
The salvage market is also an auction and, in the US, also dominated by two companies, Copart and Insurance Auto Auctions (IAA), who each have roughly ~40% share, with the next largest operator claiming just 3%. But unlike the whole car auction market, which is closely tied to transaction “flow”, salvage auto auctions are supported by the “stock” of outstanding vehicles, providing a stable source of volume as every year some reasonably predicable percentage of the ~280mn cars on US roads get into accidents and sometimes those accidents are serious enough that the cars involved must be pulled off the road entirely. Around ~13mn are removed from the fleet every year(1), of which 4mn are siphoned to salvage auctions that are more likely than not operated by either Copart or IAA. Insurers bring 80%-85% of the cars that run through these auctions, though no single customer accounts for more than 10% of Copart’s revenue.
The other side, the buyer side, is more fragmented: sometimes dealers or repair shops buy the whole car and rebuild it, sometimes they dismantle it for parts and, in the case of LKQ, sell those parts to collision repair shops, who buy from LKQ to appease cost conscious insurers directing huge repair volume to shops using less expensive recycled parts for damaged cars. I’ve heard LKQ described as a business with low entry barriers, but actually, it can be quite difficult to replicate the scale advantages of a disciplined distributor with relatively superior local route density. Tens of thousands of mom-and-pop collision and mechanical repair shops receive unexpected service requests that must be expeditiously handled. Under pressure from insurers, who account for 85% of car repairs and who expect rapid and cost effective service, shops will buy from distributors that can most rapidly deliver the broadest range of SKUs with the shortest lead times at the lowest price, so clustering facilities in such a way that they can be economically loaded with inventory from a regional hub and also near customer premises, affords scale advantages.
Logistics/distribution-type companies with the loftiest returns – Fastenal, MSC, Old Dominion, Copart, Rollins – strongly bias towards organic growth and small tuck-ins relative to peers who undertake splashy “strategic” or “platform” acquisitions. High return stalwarts expand by methodically adjoining adjacent service territories to an existing, heavily utilized logistics base. As I wrote in a prior post:
“FAST is a prime example of how disciplined incremental expansion into adjacent product and geographic space can build to significant competitive advantages over time. In the Company’s case, we see this along three different vectors: 1) geography – from its Midwest origins the company expanded into nearby surrounding territories, building local market density that offered scale advantages in distribution and higher service levels at lower cost to customers; 2) product – FAST leveraged its existing strength in fasteners to expand into non-fastener maintenance and supply; 3) business model – the company is now building on its legacy distribution and store network to offer onsite customer service at a cost that most competitors can’t match.”
Expanding incrementally and leveraging local incumbency is not the path that LKQ has taken. The company has grown its revenue base from less than $1bn in 2006 to over $10bn today largely on the back of acquisitions. It has done 260 of them since its founding in 1998, pushing its presence beyond North America to the UK and continental Europe; beyond recycled auto parts to aftermarket products and accessories distribution for specialty vehicles (RVs and trucks). I don’t know this company intimately well, but its growth strategy feels rather unwieldy, its operational discipline wanting. EBITDA margins in North America, its most mature segment, have expanded by just 80bps over 5 years while European margins have declined. A bull might claim that its profitability profile is distorted by acquisitions, especially in Europe, and that those margins are really expanding on a “look through” basis, but I could just as easily argue that a key source of value extraction in logistics roll-ups comes from layering incremental demand atop existing infrastructure and routes, so margins should be trending persistently higher, roughly concurrent with the tuck-ins themselves.
Rollins, which regularly funds mom-and-pops with internally generated free cash flow; shuts down those acquired branches; and consolidates their customers onto existing routes, has seen its EBITDA margins inflate by over 300bps since 2012 on low/mid-single digit organic growth that is comparable to LKQ’s North America segment. LKQ boasts #1 share in a variety of international markets, but the company purchased that distinction, and as auto parts distributors and the insurers who dictate repair flow operate locally, what is the synergy that LKQ brings to these far flung territories? In its hypothetical pro forma acquisition scenario slide, management claims it is buying companies at just under 5x year-2 EBITDA (8x trailing)…and yet the company’s consolidated returns on invested capital, at ~10%, are unimpressive and have gone nowhere for 14 years. Nor are the low-teens EBITDA margins in North America, the most mature and highest margin segment, indicative of what is typically delivered by a dominant, best-of-breed distributor with massive scale advantages. Auto insurers are a pretty consolidated bunch, with the top 10 accounting for 70% of written premiums. They are offsetting claims cost inflation by pressuring repair shops to use recycled parts that sell for half the price but are nonetheless just as reliable as OEM replacement products, a significant demand tailwind for distributors of recycled salvage parts.
LKQ’s high single digit national marketshare is many times larger than the next largest distributor – competitive differentiation derived from scale economies is relative; it is usually better to have 5% share of a market whose second largest player accounts for just 1%, than to be one of ten players who each have 10% – and so bulls have argued that LKQ is favorably positioned in a static Porter’s 5 Forces framework against the 10s of thousands of defenseless, commodified, and fragmented collision and mechanical repair shops that comprise its customer base. But saying that LKQ has dominant share in North American parts distribution obscures meaningful nuance – i.e. a chain of repair shops may have negligible market share nationally but a dominant presence locally – and says nothing about the change in relative share. Insurance carriers are looking to streamline their claims operations and directing ever more repair flow to a limited number of service providers. This, combined with the growing complexity of auto repairs, which require shops to invest in costly specialized equipment and training, is in turn fueling consolidation among repair shops, whose ranks have dwindled from 65k in 1990 to around 30k today.
Since 2000, the proportion of repair volumes handled by multi-shop operations (MSOs) has gone from ~10% to nearly 40%. Against that context, LKQ’s national network may position it to win a growing share of broader distribution agreements from ever consolidated repair chains, but since the company would no longer be dealing with small mom-and-pops, its relative bargaining position is worse off. Nor does LKQ appear to have meaningful procurement leverage. Even as the largest buyer, LKQ does not comprise even 4% of the total cars sold through an auction industry that is run by just two players. And if you want to argue that LKQ has sourcing advantages outside of salvage, well, where is it? Gross margins have deteriorated over the last 7 years, from 44% in 2010 to 39% in the last 12 months. I don’t think LKQ is a bad company; it just doesn’t seem as sweet an opportunity as typically pitched, in my opinion.
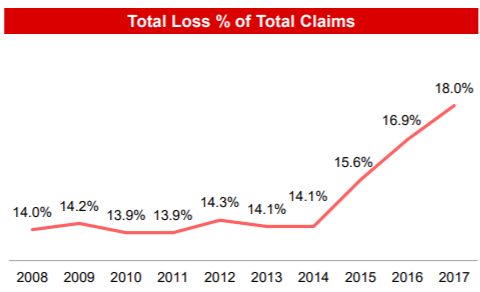
To the extent that the bull thesis rests on responsible international expansion and a favorable view on the broader trends driving accident rates, Copart and IAA seem like superior bets. About those trends. When a car gets into an accident, an insurer must determine whether or not the vehicle is worth saving. It does so by comparing the cost of repairing the car versus the amount it could recognize by deeming the vehicle a total loss and selling it at a salvage auction. So, if a car was valued at $10k before the accident and it takes $6k in repairs to restore the car to its “pre-accident value” and another $1k to supply the claimant with a rental while his car gets fixed, then the insurer will choose to send the car to salvage if it thinks it can get more than $3k for it at auction [that’s $10k less $6k less $1k], and repair the car otherwise. The proportion of cars deemed a total loss has been trending higher over the last several years, driving growth in salvage auction volumes:
[In the early/mid ’90s, the total loss % was more like 10%] For every 5 cars that get into accidents, 1 is sent to a salvage auction, where it might be claimed by recycler like LKQ who sells the parts used to repair the other 4. Ever year, cars are being decked out with more and more safety features and technology – airbags, crumple zones, computer systems, cameras, sensors, navigation systems – making them more expensive to repair and more likely to be deemed a total loss when involved in an accident.
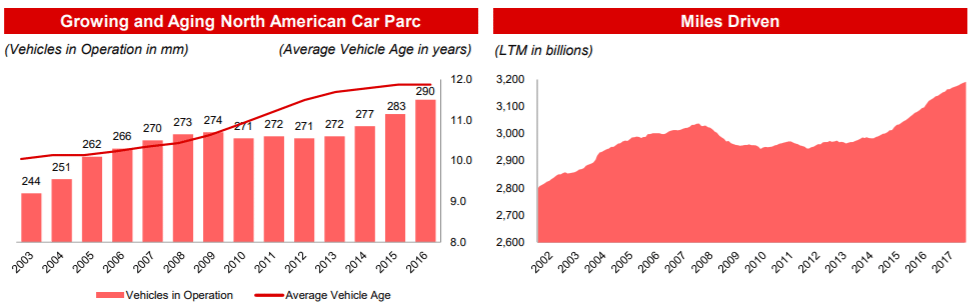
Moreover, mounting consolidation among repair shops, which attenuates LKQ’s bargaining power relative to its customers, conversely helps Copart and IAA, as these MSOs exert pricing power and exacerbate the rising the cost of repairs. Meanwhile, the demand for cheaper recycled parts, which acts as a significant tailwind for LKQ, also helps Copart and IAA as recyclers participate in salvage auctions to source totaled cars for parts inventory. Furthermore, the median vehicle age has gone from ~10 years a decade ago to ~12 years today while the percentage of really old cars in the car parc, those 11 years and older, have grown from 33% of the car parc to over 40%. Older cars are more likely to be salvaged because their repair costs make up a relatively high proportion of pre-accident value, all else equal.
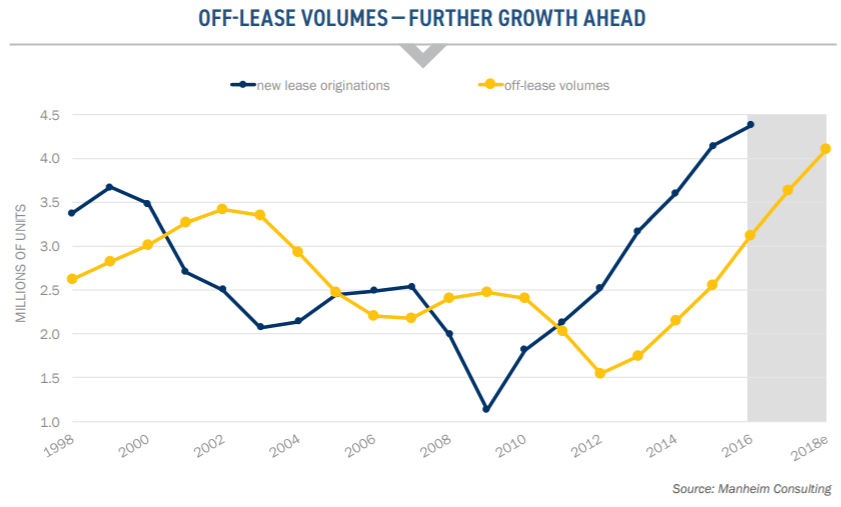
Total loss claims will be further buoyed to the extent that the impending deluge of vehicles coming off lease pressures used car prices (“pre-accident” values will be lower).
[At the end of its lease term, typically ~3 years, a car is returned to the captive finance company, who funnels it to either the wholesale or salvage auction market. The growing proportion of leased cars in recent years – in 2010, less than 13% of new car transactions were leases; today, that figure is over 30% – continues to provide some support to salvage volumes, but keep in mind that captive fincos are a subset of the less than 20% of Copart’s auction volume derived from non-insurance companies, so it’s not a huge deal(2)]
So, repair costs and salvage auction participation are both going up while, speculatively, used car values are probably going down. The diverging trends provide a happy tailwind for salvage auction activity.
On top of all that, the number of car accidents has been rising along with the number of cars on the road (and correspondingly, the number of miles driven)…
…and after a 15 year stretch during which the number of crashes per million driven miles declined, the crash rate has ticked higher in recent years, supposedly boosted by texting/emailing while behind the wheel: over 30% of respondents from an AAA Foundation for Traffic Safety survey reported texting while driving in the last 30 days; the National Safety Council claims that 1 in 4 crashes is influenced by cell phone use. But, even if this troubling trend proves to be a fluke that reverses, salvage volumes should still continue to grow as they have in past decades, when falling accident rates were more than offset by rising total loss frequencies (which latter are mainly a function of repair costs relative to used car prices, which I’ve already explained are trending higher).
You’ll notice that the constituent drivers of Copart’s revenue growth have naturally offsetting properties that promote growth even when times are bumpy for the auto industry as a whole. For instance, lower average used car prices, in isolation, are ostensibly bad since over half the company’s service revenue [fees charged to vehicle sellers and buyers] is correlated in some way to the selling price of the vehicle…but weaker prices also increase the proportion of repair costs to pre-accident values and makes it more likely that the a car will be totaled rather than repaired. In FY09 (ending July 2009), Copart’s service revenue shrank by less than 1% y/y, as higher salvage frequency and market share gains substantially counteracted the harrowing fallout of the last recession, including not just weaker used car prices, but the headwinds of dollar strength (around 30% of the cars at Copart’s auctions go to international buyers), commodity weakness, and a shrinking car parc. [Cars that are discontinued or built by manufacturers seeking bankruptcy protection, as occurred during the last recession, see their resale values impaired, which also helps salvage frequency.]
Still, looking past the cycles, we have to contend with the longer-term secular trend towards autonomous transportation. Where will pools of value accrue in what will surely be a dramatically transformed ecosystem of OEMs, mechanical parts suppliers, electronic component vendors, repair shops, dealers, etc., and what are the knock-on effects to parking lots, gas stations, urban planning, emergency room visits, and whatnot? I certainly don’t have the answers, but at least on the first question my best guess is that the hardware components enabling autonomy – sensors, LIDAR, cameras – will eventually be commodified and value will flow to those owning the mapping and autonomous driving software required to optimize routes and maneuver through surrounding environments. I’m less sure that excess profits accrue to those purely matching riders to cars because, notwithstanding the cross-side network effects between drivers and riders, the question of customer ownership is rendered fluid by the fact that the drivers (or, eventually, autonomous cars) are not captive and rider switching costs are low.
Mapping and autonomous software benefit from machine learning empowered data network effects – more traversed miles translate into more granular maps and driving scenarios that better utilize and make smarter, all the vehicles in a service fleet – so, a dominant ride-sharing service or autonomous car manufacturer today might bootstrap its way to a competitive advantage founded on maps and software. I don’t know. But 20 to 40 years from now, when fully autonomous vehicles can be readily beckoned in most major metros, there will surely be far fewer accidents than there are today (driver error accounts for 90% of all accidents)? They may get so good, in fact, that a lot of the expensive safety features found in cars today are obviated away. Both developments carry existential undertones for salvage auctions, whose volumes are influenced by both the frequency of accidents and the severity of damage (as measured by repair costs per damaged vehicle).
Copart’s management put out a presentation several years ago that in “skate to where the puck is” fashion, cited some surveys and expert opinions purporting that consumers are resistant to self-driving cars and that the skills of autonomous vehicles do not rival those of human drivers. In the same presentation, management pointed out that there are ~260mn cars on the road and, assuming a ~17mn SAAR and an average car life of 15 years, it takes a really long time for new technology to meaningfully penetrate the car parc. But autonomous vehicles will make a significant impact on accident frequency well before they take over the car parc as every fully functional autonomous vehicle lowers the odds of collision with several other vehicles. How long it will take before we get to a point where this starts to matter is, of course, an open question. With respect to salvage auction volumes, we may be in a sweet spot today where technology is making cars more complicated and expensive to repair and safer for drivers who do find themselves in an accident, but is not yet good enough to materially reduce the frequency of accidents that is at least partially attributable to the modern day scourge of smartphone addiction…and, I can see this state of affairs persisting on the 5-10 year time frame that is relevant to me (and many of you). As long as that’s the case, salvage volumes will likely continue plodding along at a high-single digit rate of growth – fueled by a low-single digit growth in claims, a growing proportion of which result in total losses due to rising repair costs – and value will continue migrating to the two largest players, Copart and IAA, who together share 80% of the US market.
Both companies have built up scale advantages over 35 years that would be very difficult to replicate. [IAA got into the salvage vehicle business in 1982, the same year as Copart. It went public in 1991, grew through a series of acquisitions, was acquired by private equity in 2005, and together with ADESA was merged into KAR auction services in 2007. IAA is now in the process of being spun-off of KAR.] An insurer tries to minimize its claims costs by either minimizing repair costs on the cars it saves or by maximizing the salvage proceeds for those it deems a total loss. The latter is best achieved by creating competition among a large base of potential buyers, who in turn seek a reliable source of supply across a broad range of models…buyers attract sellers and sellers beget buyers in the feedback loop characteristic of marketplaces.
Way back in the day, Copart’s salvage auctions were conducted locally, so if you wanted to bid, you’d have to drive to the physical auction site and position yourself among a throng of other buyers before a gavel-dropping, magaphoned auctioneer (“going once, going twice…”). This meant that buyers and sellers were sourced from a tight radius (~150 miles) and that the cross-side network effects were geographically confined. But the boundaries of the auction have expanded, thanks in large part to internet enabled bidding. [Beginning in fy04 (ending July), Copart embarked on a journey to conduct all its auctions in online. These virtual auctions are split into two phases. In phase 1, which starts 3 days before the “real”, live auction, buyers submit the maximum price they are willing to pay for a vehicle and Copart’s system incrementally bids up to that price on behalf of the buyer, who receives an email if he is topped. The winning bid in phase 1 sets the starting price in phase 2, when bidders compete in a real time virtual auction environment.] Online auctions have made it far more convenient for buyers from faraway locations to participate, regardless of weather conditions, resulting in more competing offers from buyers, higher realized prices for sellers, and indirectly, more revenue for Copart, whose transaction fees are partly tied to vehicle selling prices. Today, nearly half of Copart’s auctioned vehicle volumes are sold to buyers residing outside the state where the vehicle is being auctioned [30% to out-of-state buyers inside the US; 20% to international buyers].
To be fair, KAR, which runs both physical and online auctions, disputes the notion that running purely digital auctions delivers higher selling prices, contending that online auctions cannot replicate the action and excitement being there live, in person. Yet, half of IAA’s vehicles are sold to internet buyers. While this is well below the over 80% of salvaged vehicles that receive an internet bid – implying that the topping bid more often than not comes from someone on the ground – the realized selling price would likely have been lower without incremental demand from the online channel. And virtual bidding brings other benefits besides: it takes out the operating and capital expenses required to run live auctions (though these are somewhat offset by the incremental IT expenses required to run auctions online), allows buyers to bid in multiple auctions simultaneously, and speeds up auction sales since, as described in the brackets above, some of the price discovery occurs in the preliminary phase leading up to live action.
While bidding may be just as easily done online as in person, having a physical presence still matters a lot because of transport costs. Copart relies on third party haulers to move damaged vehicle from the towing company to one of its ~200 storage facilities (or “yards”) and to then take the car from the yard to the buyer. Too few sites will result in obstructive crowding at existing locations and higher transport costs, which get passed down as higher transaction costs to buyers and sellers, making the venue operator less competitive relative to someone with more locations. A dense yard network helps in cost effectively sourcing damaged vehicles…and the more vehicles you have running through your auction, the more bidders you will attract, and the better returns you will earn on yard investments(3). It also allows Copart to strike regional and national supply agreements with insurance companies. These two instantiations of scale – the lower unit costs of operating a network of physical yards and the network effects of an auction – have reinforced one another for over 35 years, producing a system that supports 1mn vehicle searches/day and attracts 44mn bids/year to find homes (or graveyards, as the case may be) for over 1mn damaged vehicles. [Besides the fees that it takes from both the buyer and seller in each transaction, Copart also offers various ancillary services. One of these services is a salvage estimation tool called ProQuote that leverages the millions of data points it has gathered through its auctions – including make, model, year, severity of damage, season, scrap metal prices, and proximity to ports – to arrive at ever more accurate predictions of how much a damaged vehicle would get in an auction, allowing insurance companies to make wiser repair vs. salvage choices…so, data network effects are a third kind of relevant scale, albeit of much smaller importance].
Management has moreover complemented these scale advantages with operating discipline and thoughtful capital allocation. Rather than pulling an LKQ – levering its balance sheet and spraying capital at far flung markets – Copart has taken a more measured approach, investing around a quarter of its free cash flow into acquisitions over the last decade to infill existing markets and gain toeholds internationally, bolstering those new geographies with tuck-ins and organic development. Because Copart’s online auction format produces a globally distributed buyer base, when the company lands in a new market, it brings with it 750k registered members from around the globe, such that, as management put it, “when we open up in a market like the UK, we start selling motorcycles in the US.” This is different from a distributor like LKQ, whose scale economies are predominantly local. Copart’s International EBITDA margins are still below those in the US (30% vs. 39%), but the key point is that margins have trekked steadily higher, from just 23% in FY14 (when management first broke International out as a separate segment) and will continue doing so as the company densifies these markets and scale economies kick in.
Eventually, I don’t see why margins in Copart’s international markets – UK, UAE, Bahrain, Oman, Brazil, Spain, India, Ireland, and most promisingly, Germany – can’t rival those of the US. You could even make the case that the relative value proposition that Copart offers is stronger in continental Europe. The European market differs from the US in that insurers there reimburse policyholders only for the diminished value of the damaged car. It’s up to the policyholder to sell the total loss vehicle in order to recover the rest. With Copart’s model, the policyholder is reimbursed for the insured amount and can replace his damaged vehicle right away; the insurer takes on the responsibility of placing the car in auction, but, if recent auction results are any guide, realizes a higher return relative to existing remarketing methods; and the buyer, who often had to wait up to 3 weeks to know if his bid was accepted, now gets a steady, reliable flow of inventory. Everyone wins. It is then perhaps no wonder that the number of participants and unique bidders per auction are higher in Germany now than they are in North America, despite the former market’s relative immaturity.
And then there are the buybacks, which are lumpy and sporadic, as they should be. Included in Copart’s share repurchase history are two big Dutch tender offers – one in 2011, in which it retired ~14% of its share count and another in 2015, where it took out another ~11% – executed at prices that were a fraction of where they are today (~$10 in 2011 and ~$19 in 2015, split-adjusted vs. the current share price of $56), at earnings multiples significantly below current levels [management did not tender any shares in either of these auctions]. That the company hasn’t repurchased any of its shares in fy17 or year-to-date should perhaps tell you something about how appealing Copart stock is at 34x trailing earnings 🙂 A formidable scale-based competitive advantage supported by a responsible expansion plan has produced enviable returns on capital: EBITDA (no add-backs, no bullshit) has increased by $255mn over the last 7 years through fy17 on incremental gross capital of $845mn; pre-tax returns on gross capital have averaged around ~24% since fy11 with modest variation.
Finally, while stressing the importance of values and culture is eye-rollingly platitudinous, I can’t help but look back to 2005 and applaud CEO Jay Adair’s response (Jay was President of Copart at the time) to a question posed by a model-tweaking analyst who could think of nothing better than to wonder whether Hurricanes Katrina, a disaster that killed nearly 2,000 people and displaced 400,000, offered an opportunity to implement price hikes (4):
“I’m not going to have that discussion. It’s not Copart’s style. I wouldn’t do it. In a situation like this where an area has been so negatively impacted…So in this kind of situation, these major carriers are doing everything in the world they can to service their client base. I have to do everything I can to service them. I just don’t think it’s appropriate to even think of hitting them with trying to make a profit on this. I could not hit them with a price increase, I couldn’t do it.”
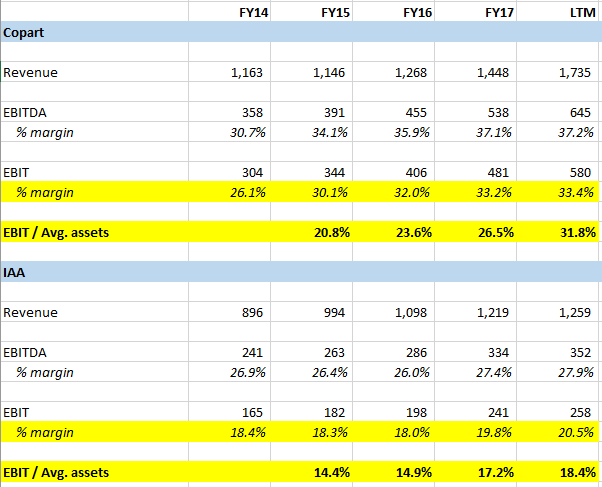
Does this answer give me the fuzzies? Naturally. I admit, I’m a sucker for this kind of stuff. But treating your customer well in hard times also happens to be sound long-term business (obviously). Before departing, I thought it might be helpful to put Copart side-by-side with IAA, as the gaping valuation disparity between Copart and KAR Auction Services – 21x EV/EBITDA for Copart vs. 11x (EV+capitalized rent)/EBITDAR for KAR, which, unlike Copart, predominantly leases rather than owns its facilities – seems interesting given IAA’s impending spin. Here is a high level view of Copart’s financials vs. IAA:
There are several important caveats. First, Copart and KAR have different fiscal year ends and I was too lazy to align their numbers. Doesn’t matter. The point is that Copart generates higher pre-tax returns than IAA on a similar revenue base [you can go back to FY16 when Copart generated the same amount of revenue as KAR does today and see that Copart’s returns were still higher].
Second, as I previously alluded to, IAA mostly leases its facilities while Copart mostly owns. KAR’s management claims that its rent expense comes to around 12% of revenue, which would account for all the margin differential, but can this be right? KAR’s total lease expense in 2017 was ~$164mn, which is indeed around 12%/13% of IAA’s revenue, but of course KAR is much bigger than IAA and includes a whole car auction segment, ADESA, which accounts for ~1/2 of KAR’s revenue and segment EBITDA. Surely some of KAR’s lease expense should be allocated to ADESA (or AFC, the company’s floorplan financing segment). But, let’s just say that rent is around 6% of IAA’s revenue. Even if we add those 6 points to IAA’s margins and generously make no reconciling adjustment to assets, IAA’s pre-tax ROA still falls short of Copart’s. Moreover, IAA’s margins don’t include any allocation of KAR’s corporate overhead, which is meaningful at around 15% of total segment-level EBITDA. Also, in the above table, I included all of KAR’s EBITDA add-backs except for stock comp and did not do likewise for Copart (in fact, refreshingly, Copart’s management doesn’t even disclose an Adjusted EBITDA figure). Finally, compared to IAA, Copart has a much higher mix of international business, which (for now) generates only ~15% ROA vs. 30%+ in the US, so comparing IAA to Copart USA only exacerbates the returns disparity. So, there does appear to be some kind of structural advantage or operational discipline in play at Copart that is lacking at IAA.
I thought maybe IAA’s cost structure included temporary cost bloat from acquired companies, but that doesn’t appear to be the case, as nearly all recent acquisitions and most of KAR’s goodwill is related to ADESA. We’ll get more clarity on what IAA looks like as an independent entity when the Form 10 comes out, but for now when I allocate corporate overhead according to revenue, I get around $300mn in EBITDA. This doesn’t deserve to trade at Copart’s 23x multiple (heck, that multiple isn’t exactly cheap for CPRT), but nor does KAR’s 10x multiple seem entirely fair.
Footnotes (1) vs. 17mn new cars that enter the fleet every year.
(2) Another subset includes cars from municipalities and charities. These cars tend to be really shitty, low value ones that nonetheless take as much time and land to sell as a higher value insurance car, so management has been pulling back on this supply channel.
(3) As you might expect, a new yard may to some degree cannibalize an existing one (and present a headwind to same store sales growth), but the trade off is well worth it if you can fill up both yards and do so with lower unit towing costs. For this reason, growth in same store yard sales, which management stopped disclosing several years ago, can be a misleading measure of financial health.
(4) In natural disasters, Copart bears upfront the outsized costs transporting a huge number of damaged cars, many of them high value, to its facilities, which temporarily depresses margins until those cars are liquidated in auction months later, whereupon margins get a lift. Net-net, hurricanes help Copart’s profits.
scuttleblurb business update (2020)
Posted By
scuttleblurb
On
In
Business updates,SAMPLE POSTS |
4 Comments
I recently did an interview with my friend @LibertyRPF[3]. It will serve as a substitute for my 2020 year-end review since it contains everything I wanted to say (and more).
With permission from @LibertyRPF, I have reproduced the interview below. You can access the original here[4].
Interview with David Kim a.k.a. Scuttleblurb
𝕊𝕡𝕖𝕔𝕚𝕒𝕝 𝔼𝕕𝕚𝕥𝕚𝕠𝕟 #𝟙
Scuttleblurb[5] is one of my favorite sources of investing/business information, and its creator, David Kim[6], is one of my favorite people I’ve met online (we haven’t met in person yet, but I hope to fix that someday… hurry up, Pfizer!).
As a writer, he’s who I want to be when I grow up.
He dives deep into companies and industries, but not in the typical way of many financial writers: He’s not trying to pitch you, he’s not starting with a conclusion in mind that he’s trying to justify by cherry picking info. He immerses himself in a business for a while and then reports what he finds about industry dynamics, management quality, unit economics, competitive advantages, how historical developments have made things the way they are today, etc.
He’s more ‘Magellan writing about his voyages’ than ‘salesman trying to get you to buy that shiny Dyson’…
His pieces often conclude on some shade of gray, without a clear call to action or price target, but I like that. It’s how the real m’f’kin’ world works.
Enough from me, let’s go to David (I’m in bold):
Hi David, thanks for doing this, I really appreciate it! I know you must have your hands full between the piles of transcripts and 10Ks and the new twins.[7]
Thanks back. I very much enjoy your eclectic newsletter. It’s one of the first things I read in the morning. I also appreciate that we’re doing this interview in writing, which I much prefer to speaking.
I don’t want to assume that everybody reading this already knows you and reads your stuff, so could you start by telling the reader who you are, what’s your background and how you got to where you are now, and what’s your day job these days?
These days I write the scuttleblurb blog[5] and manage a small fund. Prior to doing either, I was a research analyst at a L/S equity hedge fund.
The reason I started scuttleblurb is that I had just launched a fund with no prospective investors and my wife Maria and I needed a way to pay the bills. I write research notes as part of my investment process, and I put those notes online hoping people would pay to read them. Very few did.
So it was mid-2017 and we were stuck. scuttleblurb was going nowhere. My big idea for getting people to discover and then pay for my work was sending personalized emails and handwritten letters (really) to fund managers and analysts, with coupon codes and free trials and such. I spent a few thousand bucks advertising on marketfolly, which worked all right, but otherwise scuttleblurb got no traction. Maria and I just had our first baby and we were scraping by on her teaching salary plus income from a condo I was renting out as we weighed my non-existent career options. Then you somehow discovered my blog [Finding stuff is what I do! -Lib] and tweeted a link to one of my posts. Then so did @Bluegrasscap[8], @Intrinsicinv[9], and a few others.
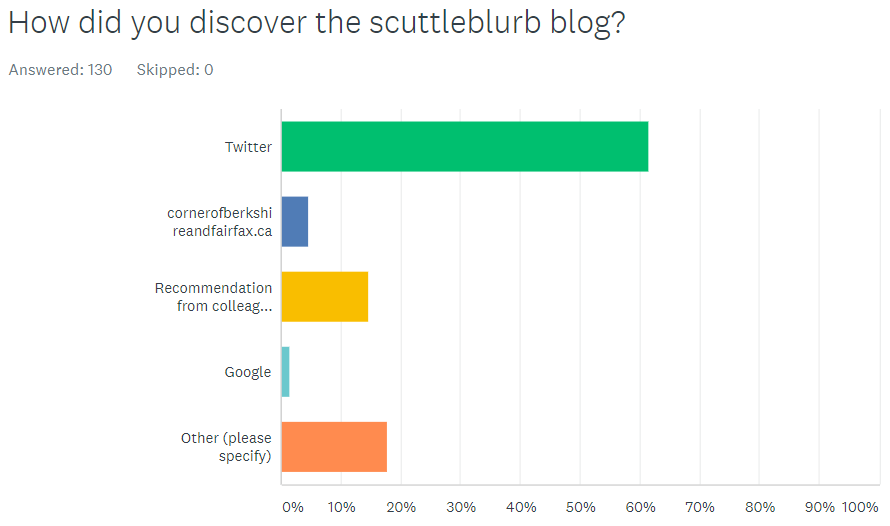
I didn’t use Twitter at the time. I had a zombie account with like 40 followers that I barely touched. So you can imagine my surprise when the blog started to gain followers on this geeky community I had never heard of called FinTwit. I kept writing, people kept tweeting my posts, and here we are. I estimate that more than 70% of my subscribers have come from Twitter word-of-mouth. I’m so grateful for FinTwit. This community lifted me on its shoulders when things looked utterly hopeless. I honestly get a little choked up thinking about it.
What fascinates me most is your research process. You do such a good job, I’m curious what techniques I may be able to learn from you, though I suspect that there are no real tricks, just lots and lots of reading, asking questions and then tracking down answers, figuring out what is most important to focus on, etc… Can you describe what the research process is like for one of your long posts or series of posts?
Like every analyst, I read SEC filings and transcripts, Google, watch relevant YouTube videos, talk to management (usually IR), and do the same for competitors and anyone else of note in the ecosystem.
I write up every company that sparks my interest, whether I find the company an attractive investment opportunity at the time or not. I recall you mentioning that you research companies that speak to you regardless of how pricey they are and then keep those companies on a watchlist so that you’re ready to pounce when valuation approaches something reasonable. I’m the same way.
Speaking from personal experience, most investment funds don’t let their analysts do deep dives on interesting companies trading at uninteresting valuations. Try telling your PM that you’re going to spend a month studying such-and-such industry because you find it interesting but there’s probably nothing to buy at the moment and there may never be. See how that conversation goes. It’s nice to be able to set your own research agenda.
But in the time it takes for a sane valuation to arrive you may find yourself forgetting what it is you found so interesting about the stock in the first place, so it’s useful to have a write-up to refer back to. For the sake of efficiency, many analysts jot down bullet points and preserve a folder of notes, but there’s something about long-form prose. I can’t explain the underlying mechanics of how it happens, but oftentimes the very act of writing sparks an idea and exploring that idea in more detail leads me to an important point that I don’t think I would’ve grasped otherwise. This was true with Align Technology [Link for SB members[10]. -Lib], which on the surface looked like a static collection of expiring IP selling a commodity product whose economics were just waiting to be siphoned away by low-end clear aligner competition. Writing led me down the track of thinking about Align as a system of reinforcing pieces – data from case starts enabling more complex malocclusion cases; vertically integrated software and hardware crowding out competing solutions and saving orthodontists chair time; a strong brand synonymous with clear aligner treatment – that in concert fueled more case starts, data, manufacturing process improvements, orthodontist adoption, etc. (there’s an argument to be made that Smile Direct Club is re-setting the basis of competition and presents the first major competitive threat to Align in over a decade, which I’ll likely touch on in a future post).
I don’t mean to sound prescriptive. I think many people find writing to be mentally taxing and maybe the time spent writing would be more efficiently put to use elsewhere. I just happen to enjoy writing, it’s like therapy for me, but I don’t want to promote an approach that may not make sense for most others.
I’m the same. Writing is very hard even if I enjoy it, but it’s also very fruitful because it’s hard. Writing is hard because thinking is hard, and on the page the gaps in logic and missing pieces of the puzzle can’t be hand-waved away as easily, while with what I’d do otherwise — the path of least resistance — my brain would probably skip over a lot more holes and leave some interesting doors unopened.
As far as what I focus on, I spend a lot of time trying to understand a company’s advantages or the advantages it might build up to. Earning a decent return on the growthy compounders I often write about at today’s valuations means you have to be right about the secular trend, the state of competition, and the ability to execute/adapt. Those are basically the 3 core elements. The secular trend is often the safe bet because it’s readily apparent to all that more compute is moving off-prem, that connected TV is taking share, that telehealth adoption is infiltrating healthcare, that semiconductor consumption is accelerating, and so forth, whereas the state of competition over the next 5-10 years can seem much more distant and abstract. The boundaries of competition can be fluid, especially in tech, and justifying current valuations often means assuming the company successfully trespasses into adjacent, already occupied territory. Maybe for companies with low enough market caps, you can lean on the “there’s plenty of TAM to go around and I just need to be directionally right” defense, but compounding at 20% over the next 7 years on, say, Snowflake, a $75bn company trading at 150x revenue (or wherever it’s at now), means being right on the specific state of the data management ecosystem and Snowflake’s ability to capture value within it.
The other thing I try to do is provide context, nuance, and caveats around different explanations in order to avoid overfitting concepts and mental models. LendingTree [Direct link for SB subs[11]. -Lib] might look like a classic marketplace that scales through cross-side network effects between lenders and borrowers, but I think it’s more aptly described as a sophisticated marketing coop that arbitrages online ad inventory. Live Nation [Direct links for SB subs, #1[12] and #2[13]. -Lib] is often described as a flywheel, but it looks more like a bundle that loss leads through a promotions biz. Sometimes network effects are relevant but they’re not really the moat they seem to be. Equity exchanges enjoy network effects in that buyers attract sellers and vice-versa, and the growing concentration of liquidity narrows bid/ask spreads, in turn drawing more buyers and sellers. But in the mid-2000s, as legacy equity exchanges lost regulatory protection, non-exchange trading platforms stole enormous share through superior technology and the backing of powerful brokers. Yelp has network effects in theory, but Google guards the front door and absorbs most of the value in local search. Symantec, Cisco, Palo Alto Networks [Direct link for SB subs[14]. -Lib], and other cybersecurity vendors monitor trillions of telemetry points, but the resulting data network effects seem to be quickly arbitraged away, and that’s something to consider when evaluating the explanatory weight of network effects for the post-2010 breed of cloud native, zero-trust vendors.
By overapplying cherished concepts, you risk minimizing the importance of other factors or confirmation biasing your starting theory. An analyst begins to treat the diligence process the same way an attorney might, selectively gathering evidence to defend a starting hypothesis rather than considering the case from multiple angles to surface the best explanation. Maybe mismatches between changes in balance sheet items and the cash flow statement confirms your starting thesis that Company X is a fraud, and you so badly want this to be true that you don’t give due consideration to another plausible explanation….that under GAAP balance sheet items are translated from local currency to USD at period-end exchange rates while the cash flow statement is translated using monthly averages, which can create large discrepancies between the two during periods of volatile FX movements , discrepancies that are accounted for in shareholder’s equity.
And sometimes you dismiss the existence of moats in places where you don’t expect to find them. In Surfaces and Essences, Douglas Hofstadter talks about how a given item can belong in many unrelated categories depending on context. The image of a basketball rolling, for instance, is more readily accessible than that of a basketball floating because most of our observations and experiences related to basketballs have been on the ground. We think of airlines as intrinsically terrible businesses, loaded with high fixed costs, selling a commodity product, prone to price wars and periodic bouts of bankruptcy. But the same set of conditions may create advantages for disciplined airlines like Ryanair [Direct link for SB subs[15]. -Lib] and Wizz Air [Direct link[16]. -Lib], who at the expense of bloated competitors, leverage superior unit costs to maintain low ticket prices, generating more passenger volumes on a fixed cost base, fueling better landing fees with airports and volume discounts on aircraft, thereby reinforcing the cost advantage. This starts to look like a flywheel, a designation that we typically reserve for consumer internet and tech companies.
The set of concepts and mental models that you have at your disposal will evolve over time and with experience you get better at not only drawing on the right ones but doing so in a way that is unfettered by preconceptions, proportionate to the case at hand, and peppered with the appropriate caveats.
I can’t tell you how many bearish SaaS pitches I read 5-10 years ago that were predicated on accounting-based red flags and quarterly billings weakness, factors that were just absolutely swamped by massive secular tailwinds (this has pissed off some really smart low-multiple investors because the only thing worse than being wrong is seeing someone who you perceive as less sophisticated and experienced than you being right at your expense). The Bezos flywheel napkin sketch helped me understand the reflexive properties of scale economies, but then I found myself applying the sketch to areas where it probably didn’t belong, and in recent years I’ve chilled out a bit and drawn on the concept in a more nuanced way.
Proportionality is important to sound analysis. You don’t want to start seeing flywheels and fraud everywhere you look. You don’t want to diminish the tsunami of ad spend moving to connected TV because (gasp) Trade Desk’s [Direct link[17]. -Lib] receivables outpaced revenue this one quarter; nor do you want your enthusiasm over connected TV blind you to the possibility that surplus in that domain may eventually concentrate inside walled gardens. You don’t want your commitment to low multiples steer you away from companies with compelling unit economics that are losing money as they invest in growth; nor do you want to stretch one assumption after the next to validate a purchase of a company you love (assuming, of course, that you’re optimizing for risk and reward when investing, which you may not be and that’s totally fine). By the way, congrats your investment in The Trade Desk. I sold 40% ago, oops. Why didn’t you tell me the stock would go from $500 to $800 in like a month….thought we were friends, geez. [Well, I sold ALGN a while ago and didn’t get the rebound on that one, so you win some and lost some ¯\_(ツ)_/¯ -Lib]
If it’s not an industry you already know, how do you first attack it and is it ever overwhelming? Have you ever given up entirely on something you wanted to write about because it’s just too complex?
It’s always overwhelming. My imposter syndrome is usually up to here because I cover such a wide range of companies and most of the industries I want to write about reside well outside my existing circle of competence at the time I want to write about them.
To be clear, I don’t mind being the dumbest guy in a room of specialists. I have no interest in being the sapient thought leader [I had to look up ‘sapient[18]’, good vocabulary! -Lib] with big sweeping ideas of what software or media looks like in 10 years. I see myself more as the plucky interloper at a house party, probing one room, then the next, trying to make sense of what’s going on in each. But the feeling that I have no business charging people to read something I’ve written given my lack of background knowledge and expertise doesn’t ever go away. I just do my best to push through it and trust that approaching the work with intellectual honesty and an open mind will compensate for my considerable knowledge deficits and yield something that people want to read.
What’s your Big Picture vision for Scuttleblurb? What are you trying to give the reader, and who is your ideal reader? What kind of mindset and expectations should someone have going in?
The ideal reader is someone who derives intrinsic enjoyment from analyzing businesses, regardless of sector, even without the carrot of an actionable investment idea. If you’re looking for stock tips, please don’t subscribe [Subscribe anyway[19], and then get over that urge. You’ll be better off for it. -Lib]. You will feel ripped off and I will feel bad. I try to be very clear about this up front, in the “About Me” page and in the “Subscription” page, though I think some folks may still be frustrated or confused by the absence of price targets and buy/sell recommendations. My posts will often include a back-of-the-envelope valuation section, like “under such-and-such assumptions, here are the returns you can expect”, but the point of that is to offer a sense of what you need to believe to earn 10%, 15%, or whatever. You can make up whatever numbers you want. What I’m hoping to do is provide as honest a qualitative context as possible to inform your assumptions.
Some time back, a subscriber commented that I should focus on names in which I have a high degree of conviction. I think following this recommendation would yield a barren website because there are so few stocks that meet that criteria for me. Who knows, it might even tempt me to dishonestly convey conviction where it doesn’t exist for the sake of placating readers. But more importantly, it would be out of character. I don’t really have the emotional makeup to be a “high conviction, bet-the-farm” investor and I don’t really fall in love with the companies I analyze (which can be both an asset and a liability). I could act otherwise, but over time you’d see through the facade.
I think that we tend to remember the results we see and forget the mistakes we avoid. Convincing your PM not to buy a stock that stock goes to zero will not earn you the same glory (or bonus) as convincing your PM to buy a stock that doubles. The PM doesn’t have the same felt sense of profit and loss on the stock he avoids that goes to 0 as he does on the stock he owns that doubles. Similarly, a scuttleblurb writeup that prompts a position size reduction will not get the same credit as a newsletter “high conviction list” that prompts a new purchase, even if the losses prevented in the former and the gains realized in the latter are the same. The fact of the matter is that most people want black-and-white buy/sell recommendations. They want conviction. I offer neither. This can be frustrating.
There’s value to what I offer but it’s hard to quantify. I guess I would say don’t purchase a scuttleblurb subscription hoping to make money on actionable stock ideas. Do so because you want to get a little smarter about certain businesses than you are today and trust that over the course of your career as an investor, being a sharper business analyst will pay dividends.
Do you have a long-term vision for the site that is different from what it is today?
Nope.
Almost a year ago, you wrote about how Scuttleblurb was doing as a business[20]. I don’t know if you’re planning to do the same thing this year, and I don’t want to steal your thunder, but I’m curious to know how things have been going? Has the pandemic hurt or helped your business? Are you finding that the more you grow, the more growth rate accelerates because you’re getting more name recognition in the space and you have more subs spreading the word to potential subs?
I think I’m just going to link to this interview for my year-end review. It has everything I want to say. I don’t know if the pandemic has hurt or helped the blog. Things have been going pretty well. Scuttleblurb passed 1,000 paying subs this year and it looks like my gross bookings in 2020 will be about double what they were a year ago. Bookings have gone from $19k in 2017 to $49k in 2018 to $114k in 2019 to what’s looking like maybe $230k-$235k this year (vs. $223k LTM through Nov 8), so while the growth rate has decelerated, it’s nonetheless been so much stronger than my expectations. [Very happy for you, you deserve it! -Lib]
But while growth has been strong, my annual churn rate has spiked from ~11% in 2019 to what’s looking like ~high-teens this year. Part of this I think is just that as my audience has grows, incremental subscribers are not going to be as passionate about my work as the early adopters.
Another contributing factor is competition. There has been an explosion of Substack newsletters launched this year, many of which focus on tech and media analysis/strategy. It’s like all the cool kids are giving hot takes on Joe Rogan going to Spotify and Nvidia buying ARM or providing commentary on Stripe, Ant Financial, Snowflake, Shopify….and then here’s me off in the corner writing about a 100+ year-old company that sells bacteria to dairy processors [Direct link to Chr. Hansen & Novozymes post[21]. -Lib]. Very off-trend. I write about SaaS, consumer internet, and other trendy stocks, sure, but not reliably so.
But the market for tech/media business analysis, while hot, is also crowded. When Stripe files to go public, your inbox will no doubt be flooded with Substack commentary. You do not need another newsletter breaking down that S-1. This is not an area where I can differentiate, nor do I care to. And there are so many talented writers with fast minds and fingers who can do the daily run much better than I ever will. I am a slow, plodding thinker. It really takes me a while to come up with something that I think is worth publishing. Sometimes I will sit on a write-up for over a year because it’s just not worth reading. I suck at extemporaneous thought and can’t think of clever things to say on the fly. I wish it weren’t like this.
Anyways, everyone’s now hip to the notion that customer obsession is the way to value creation, so what a real business publication would do upon seeing churn spike as mine has is find a way to write about what interests their readers most. But the truth, and this will hardly endear me to your audience, is that I spend no time thinking about what my subscribers want to read. I have always treated scuttleblurb as a personal research journal rather than a business, a way to pursue my own personal interests and get paid in the process. I’m quite sure that forcing myself to write about popular topics merely to attract subscribers would be the beginning of scuttleblurb’s end. And so my analysis and writing has got to be strong enough to compensate for incomplete overlap between my interests and those of my readers.
Sometimes the overlap is just too minimal. No amount of quality analysis on the consumer credit bureaus is going to satisfy subscribers who just want to read about enterprise SaaS. And someone looking for stock tips is not going to be satisfied with case studies. If subscribers churn off for reasons like those, so be it. I’m cool with that. If they’re cancelling because they’re looking for well-written, quality analysis and aren’t finding it on scuttleblurb, that’s a problem. I hope most of my churn is coming from the former, but I can’t really be sure.
Thanks so much for doing this, there’s so much gold and wisdom in there, it’s a masterclass masquerading as an interview. Take care my friend!
12/31/2020 update: scuttleblurb stats
[ALGN – Align Tech, SDC – Smile Direct Club] Brand, scale economies, and vertical integration
Posted By
scuttleblurb
On
In
SAMPLE POSTS,[ALGN] Align Technology,[SDC] Smile Direct Club |
1 Comment
Below is a transcript of a podcast I recently recorded. It has been lightly edited for clarity. You can find the podcast by searching for “scuttleblurb” on Apple or Spotify.
So Align technology is the company behind the Invisalign brand of clear liners. And so those are the clear removable plastic trays that are used to straighten out misaligned teeth. There are somewhere around 14 million malocclusion cases started every year. So malocclusion, by the way, when I say that, that just means misaligned teeth. 80% of those 14 million cases are still corrected with traditional wires and brackets, which implies that Align with 1.9 million cases has 70% share of everything else.
So we’ve all heard of Invisalign. I think we’re all pretty familiar with clear liners by now, but back in 1997, when Invisalign was founded, these clear liners were basically seen as a gimmick. They weren’t really seen as a real orthodontic appliance and orthodontists who were trained in wires and brackets took a lot of pride in doing these cases by hand, and they were generally very skeptical of the idea that you could fix crooked teeth with plastic trays. And so these wires and brackets were sold by companies like Dentsply and 3m Armco. And this was a B2B sale. So patients didn’t know or care about the brand of the braces. And what Align basically did was they created a consumer brand around clear aligner technology.
So they had the whole market to themselves for a while because the incumbents were realizing steady cash flows from selling these conventional braces and they weren’t going to cannibalize that business by making a big speculative bet on a product that nobody believed in. So Align technology with their clear aligner treatment was really like counter positioning against these incumbents.
The two relevant constituents here are the consumers and the doctors. So Align sells the clear aligner treatment to the orthodontists who then mark it up and then sell it to the consumers. And the value proposition for the consumers is pretty straight forward. It has to do with comfort and aesthetics. So instead of having these visible metal wires, they’re wearing a clear piece of plastic that can be hard for other people notice; it’s more comfortable because you don’t have the wires and brackets rubbing up against soft tissue; and it’s more convenient because they don’t have to make as many trips to the orthodontist for these mid treatment checkups.
And then as far as orthodontics go, the, the questions really come down to: does this work, is it economic for me? And do patients want this? So as I said, orthodontists were skeptical of this product at first, but they started feeling the pressure from two sides. Aline was doing a ton of brand marketing, so consumers started asking for Invisalign by name and clear aligner technology got better and better over time and doctors felt more comfortable prescribing it. The economics were also better. So what orthodontists realized was that even though they were paying more for Invisalign than wires and brackets, four or five times as much in some cases, the Invisalign treatments required less chair time because with traditional braces the orthodontist has to tighten the wires whereas with Invisalign, most of the treatment planning is done with software. So I’ll talk a little bit about the treatment flow.
So what happens is the patient gets their teeth scanned at the orthodontist office and that scan is electronically submitted to an Align lab. And at the lab, a technician creates a treatment plan in ClinCheck – and ClinCheck is just aligns proprietary CAD software – so it goes into ClinCheck and then the treatment plan is reviewed by the orthodontist for 10 minutes and the orthodontist and technician will sometimes go back and forth to get the treatment plan, right, but this process still saves time relative to tweaking the wires and brackets. So what that means is that the orthodontist can treat more patients and on a per chair hour basis, Invisalign is actually cheaper once the doctor gets past a certain volume threshold.
So to be more concrete about the savings here with wires and brackets and orthodontist might charge the patient, let’s say $6,000 for a malocclusion case. And the doctor will pay like 300 or 400 bucks for the wires and brackets. So the doctor makes like 5,600 bucks or 5,700 bucks per case. With Invisalign, the doctor charges the patient the same $6,000 and will pay anywhere between $900 and say $1,500 depending on their volumes. So let’s just use $1,500. The profits on a $6,000 case are 4,500 bucks. So for a single case obviously conventional braces are a lot more profitable for doctor. You’re talking 5,700 profits versus 4,500. But the key is that the total chair time is way lower for Align because Invisalign, because there are fewer mid treatment appointments and emergency visits. And there’ve been some studies on this. One of them I read was from 2013 – I think it was from an industry trade journal and I can’t attest to the accuracy of this study – but the claim was that the chair time is basically cut in half when you use Invisalign.
So yea, now with Invisalign you still have to include the time it takes to review the case in ClinCheck, so maybe that’s another 10 or 15 minutes and so maybe you’re not doing twice as many cases but you’re doing let’s say 1.7x as many cases if you assume the typical traditional case takes 180 minutes of chair time.
And also remember this study was done like eight years ago and Invisalign has gotten better and faster since then, whereas the same is not true of traditional braces. So you can frame this as clear liners versus traditional braces, but at a higher level of abstraction, this is also digital versus analog workflows, because really what you’re trying to do is straighten out these teeth as quickly as possible and a digital process can get faster and better the way an analog process cannot. With Align, there’s there’s been more like automation baked into ClinCheck, and that saves time. They rolled out a teledentistry platform last year, that saves chair time. They have a scanner, iTero, that’s gotten better, whereas I imagine it takes probably the same amount of time to do wires and brackets as it did a decade ago.
And then also orthodontists have an added incentive to move more of their caseload to Invisalign in order to obtain Elite status. And so once they get there, the orthodontist only pays 900 bucks per case. And the profit scenario I walked through earlier is obviously even more compelling.
So Invisalign is the dominant player in clear liners. And as I see it, the advantage it has basically comes down to vertical integration, patents, and then having a huge start on the competition. Align was well funded from the start and they used the capital that they got to invest in marketing, direct sales, and manufacturing from very early on. So you might be surprised to learn that Align is the largest 3D printing company in the world. So they use 3D printers to make the clear aligner molds and using these molds, they can mass customize hundreds of thousands of clear aligner trays every day. There’s a lot of small things that go into this. They’ve trained their own machine vision system to read the unique identifiers on the aligners to make sure like the right aligner, it goes in the right package. They’ve got these lasers that can trim the aligners in this very precise way so that they aren’t discolored. And so over the course of 20 years, they’ve just added new technology to their manufacturing process and they’ve gotten better at making these aligners faster, with much less material, and using less labor than their peers.
And then other parts of the process. So they have technicians creating the treatment plans in a remote lab using ClinCheck, which I mentioned earlier; they own the CAD software and there’s more automation being baked in over time; and they even have their own scanners. So it used to be that to get a mold, a doctor would apply this cold PVS goop to your teeth, and then they had to FedEx those to the lab. And those PVS impressions have been largely replaced by digital scanners, which allow doctors to get the images to the lab faster and also dramatically improves the accuracy. And they’re also like a sales tool. So with a scan, you can show the patient, while they’re sitting there in the chair, how their teeth are going to move over time and that apparently improves conversion.
And getting into scanners was a prescient move. They got there by acquiring Cadence in 2011, and this was a pretty unpopular deal at the time. So Cadence was unprofitable. And even if they got to large scale, the margins would be a lot lower than clear aligner because scanners are kind of a commodity, but what Align got early on was that scanners were going to be a key part of doing these cases more efficiently and that would drive more case volumes in the aligner business. Okay. So they got the software, the manufacturing, the scanners, all that stuff integrated, they created scale economies in manufacturing, more accuracy and speed in the treatment planning. And it’s sort of like a classic Clay Christensen right here, they shifted the basis of competition, orthodontia from effectiveness to comfort and aesthetics and then they vertically integrated key parts of this process flow in order to make a big dent in the doctor and the consumer experience.
So that’s the vertical integration piece. And then the second thing is they had just a huge headstart relative to peers. So I think the first serious direct competition was ClearCorrect. And ClearCorrect came on the scene like seven or eight years after Align. They were largely a bootstrapped company. They weren’t nearly as well funded and they didn’t start integrating manufacturing till about 2008, so they were close to a decade behind. And then along the way, Align built up a huge patent portfolio and those patents related to treatment planning; the source code that was used to create the 3d image of a patient’s teeth; the manufacturing technology; and then they aggressively defended these patents.
So there’s this competitor Orthoclear that came up in 2005. It was founded by one of Align’s co-founders and they allegedly stole Align’s IP and trademarks and in doing so, they were able to grab like 20% share of the clear aligner market in the US very quickly, but then Align basically sued them out of existence. They shut down within two years of launch. So Align’s got a lot of things going for it, but in the past it’s actually been subject to a lot of negativity by investors, at least in the circles I roll in. And my sense is that a lot of this kind of ties back to the intuition that, well, “this is just a piece of plastic that moves teeth, anyone can make that, and no one should be earning 25% EBITDA margins on this and when some of their key patents expire, they’re going to be swarmed by competitors who will underprice them”.
So yes, key patents related to digital treatment planning and CAD technology have expired over the years. That’s true and it’s important. There’s this company called uLab that launched a competing CAD software in 2018, after some of Align’s patents rolled off a year earlier, and we’ll talk about that later. But there was always more to the story. They spent years building the brand and getting a consumer adoption. They got widespread buy-in from doctors who habituated themselves to the ClinCheck system. The case volumes brought scale economies in manufacturing, which allowed for reinvestment in marketing and product development, more experience treating harder cases, which in turn drew in more adoption by orthodontists.
At least what I’ve heard from morph does is that Align just saves them time and they just know it’s going to work for most of the cases that they come across. So like why risk moving to another system when this one seems to strike the right balance between efficacy and price? I think there’s just something to be said about the power of incumbency, especially in this industry because orthodontists tend to be resistant to change. And by the way, Align learned this the hard way themselves. I think like in the early days, they invested way ahead of demand. Orthodontists were making a good living on wires and brackets, this is what they were taught in school, and they didn’t really see an urgent need to change.
So it took a lot of education and product improvements and consumer demand to finally get traction. And then the other thing is Align’s always been a pretty innovative company. They were the first ones to get into 3d printing, they built out some of their technology. Management likes to tell this story about how in their manufacturing, they tried some off the shelf, optical character recognition systems to read the identifiers on the aligners, and when that didn’t work, they built their own. Buying cadence in 2011. I talked about that earlier. I think that was a non-obvious forward looking move. I mean, I just think they’ve made a habit out of really understanding the workflow for malocclusion cases and then just like ironing out as many friction points as they can.
And then finally there are a few other possible like growth pockets to the story. They’re on fire in China. So they basically share that market with a local player called Angel Align. If you look back four years ago, China wasn’t even in the top five countries for Align and now it’s like their second largest market. So they put in a lot of resources educating and training doctors, they’re opening permanent manufacturing capacity there and introducing scanners. There really isn’t any other major US player that has made as much progress. And then Align is also making a big push and going after dentists.
Align mostly sells through orthodontists but there are like 10 times more dentists out there in the US. So there’s this metric called utilization that management discloses and it basically refers to the number of cases shipped per doctor. And for orthodontists, that number is 67 per year. It’s more than doubled over the last five or six years, but for dentists it’s only like 10 and that’s only up from seven. This could be an opportunity for them, though utilization for dentists will always be much lower than orthodontists, obviously. And I also think it’s probably a more competitive channel to get after, but we’ll see.
So that’s all good stuff, but here’s some things that worry me about Align. So first of all, something like 70% or 75% of malocclusion TAM is teenagers. And these tend to be more complex cases because their teeth are still maturing and you have to factor in jaw movement. And Invisalign can actually handle those complex cases now but there’s also a compliance issue. The ability to remove aligners…that’s obviously a problem for parents who don’t want their teenagers taking these things off and not wearing them as often as they should and losing them. I mean, you have to wear these things like 20 hours a day and then brush your teeth after meals and it’s just a tall ask for some teenagers. For the vast majority of comprehensive teen cases, as a parent, you might just prefer to like lock your kids in metal braces. So yeah, teens make up less than 20% of Align’s business, so the company is way under-indexed here. And you could look at that as an opportunity because parents tend to want the best for their kids and if parents want to get clear aligners for the kids, they’re going to pony up the five or $6,000 for Invisalign. They’re probably not going to, you know, get Smile Direct Club for their 14 year old would be my guess. But there may just also be a huge chunk of teenagers who aren’t addressable for compliance reasons, in which case what you might be banking on with clear aligners is TAM expansion, where adults who may never have considered braces come into the market.
Then there’s competition. So there are several incumbent competitors out there….the wire and brackets guys have gotten into this, their distributors have gotten into this….3M, Dentsply, Danaher, Henry Schein. I’ve heard good things about Envista.
Envista was spun off of Danaher, ClearCorrect was acquired by Straumann, which maybe gives them an edge in the general practitioner channel. For the most part, nobody has really gotten much traction. I think the reason why they’ve had a hard time breaking Align’s dominance is that they’ve essentially competed on the same terms where they’re selling these aligners that are sort of similar to Align, maybe not as good, for like 30% cheaper. That didn’t work for the reasons I talked about and if it was just those guys, I wouldn’t worry too much about Align’s competitive positioning. But where I do think Align faces some serious challenges now is on two fronts. The first is Do It Yourself treatment planning and the second is direct-to-consumer.
So we’ll start with Do It Yourself and this would be doctors 3D-printing aligners in their office. That’s what I’m talking about. So orthodontists at this point are very familiar with clear aligners. They’ve been trained on them and they know how to use them. Plus the technology has really advanced over the last decade, specifically the accessibility of computing, machine learning, and the cost of 3d printers. So it used to be that technicians would have to manually carve out each tooth in the software, and that took like eight man hours to segment each case. And that was late ’90s/early 2000s. And then fast forward to today and you can use machine learning and software to do it.
There have also been big advancements in manufacturing. So 15 years ago you would have these huge, expensive milling machines that would make the aligner molds, and they could make one model per hour. And you compare that to today, you can have a $4,000 3D printer print a model in like five or six minutes. These printers will get better and better and the regulations around this will change for the better I think. I believe right now 3D printers are technically able to print aligners directly, it’s just not FDA approved. The way it works now is you’re printing out the mold and then wrapping the thermoplastic around the molds. But from what I understand, the FDA has approved direct print of retainers and they’re going to soon allow for the direct print of aligner trays I think, which should save the doctor and the patient some time. So there’s this company called uLab that takes advantage of this technology. uLab was founded by the former CTO of Align in 2015, and it makes the CAD software that orthodontists use to design the clear aligners.
And that software integrates with third-party 3D printers. So their model is that they give away the software for free and then they charge the orthodontist per aligner. So you have, as the orthodontist customer, you have like one of two options here. You can have uLab make the aligners in their manufacturing facility in Memphis, and that will cost $19 per aligner. Or you can send the STL file to your in-house 3d printer, in which case you’re paying $2.50 per export. Or you can do a combination of both actually, so maybe you do like the first few stages in-house so the patient gets their aligners right away and then have uLab manufacturer the rest. And the kicker here is that the maximum you ever pay per case is $950. So in most cases it’s a cheaper option than Align.
And this seems to be getting traction. They launched the software in 2018 and they passed 250,000 cases recently. My best guess is maybe they do, I don’t know, 150,000 or 200,000 cases over the next year? To put that in perspective, Align did around 1.6 million over the last 12 months. So it’s still small compared to that, but yeah it’s interesting. The downside to uLab is that it’s still slower for comprehensive cases. And the reason for that is with Invisalign, the doctor is basically outsourcing the treatment planning to an Align technician, whereas with uLab, the orthodontist – or more likely the assistants – are doing the treatment planning work themselves. But uLab software I’m sure will get better at handling these more comprehensive, comprehensive cases over time. So manufacturing these aligners on your own 3D printers is still kind of a fringe practice, but I can definitely see it catching on as the software gets better and the 3d printers get cheaper and faster.
And then the other downside to uLab is that orthodontists don’t get the Invisalign brand. And my take on this is that I think brand mattered a lot when clear aligners were a nascent technology, but everyone knows about these things now. And I’ve heard orthodontists say that patients will often just go with whatever treatment they recommend, even if [the patient asks] for Invisalign at the start. So sometimes a patient will ask for Invisalign because they just don’t know what else to call it. It’s kind of the same way you might ask for Kleenex when what you really want is tissue paper…you don’t really care about the brand per se.
Here’s another thing. Another pushback you might give to uLab is that Align has all this case volume data that uLab doesn’t have and this data advantage is something that Align’s management brings up a lot. So they’ve done something like 9 million cases over their life, and the idea is that they can use data from these cases to accurately predict how teeth are gonna move in a way that takes into account all the different biomechanical knock-on effects. But yeah, I don’t know, this claim has always seemed somewhat overstated, because it’s not like Align is getting a complete scan of the patient’s dentition at every stage of the treatment process. Like the doctor isn’t taking another scan at month three, and then month six and month nine, and then sending those to Align, right? So all Align really sees is that initial scan, so they don’t really have insight into how each case is progressing over time. Now, the initial scan is important for segmentation. So, segmentation is the step where you’re identifying each tooth in the software. The software is told “here’s the canine, here’s the first molar, here’s the central incisor” but it’s not so much that you need like tons and tons of data [to do this].
I was talking to a former Align employee who worked in R&D about this and even in that initial segmentation process, there’s likely a plateau to how much of that data helps….like having 9 million cases probably doesn’t help you that much more relative to having only 3 million cases or maybe even 1 million cases. Now having said that, where I think case volumes could be helpful beyond segmentation is that while you’re not getting longitudinal data for each patient, you might still get a sense for how teeth develop, like the speed in which they move in teenagers or how big each tooth eventually gets, just by looking at patients across different age groups. And plus, there are some cases that may not go according to plan, and the doctor has to take a second scan and send that scan over to align. And so with more case volumes, you might see more of those edge cases, but yeah, I don’t know, it’s not like there’s this awesome data network effect flywheel, whatever in place here. So yeah, just wanted to calibrate this claim about the importance of data.
So anyway, the second major competitive threat I think is direct to consumer and that brings us to Smile Direct Club. Smile Direct, as well as a growing number of direct to consumer aligner companies, are bypassing the traditional orthodontist channel by selling directly to consumers, obviously. So under the Smile Direct model, there’s basically two ways that you can get treated. The first way is that they’ll mail you the PVS goop that you put over your teeth. And then you send that back to an SDC lab and SDC converts that mold into a 3D image.
The second way is that you show up at one of the Smile Direct stores. So Smile Direct, they run their own freestanding stores as well as stores inside of Walgreens and CVS. So you show up to the store, get your teeth scanned there. So before COVID the vast majority of their business, like 80% or 90% was coming through these stores. But whichever path you take, a dentist or an orthodontist that is part of the Smile Direct network is going to review the scan in SmileCheck – and SmileCheck is just Smile Direct’s software platform – so they’re gonna review it and then create a treatment plan. And then the consumer accepts the plan and uploads photos of their teeth every few months for the doctor to review. So the company it’s sort of like a tele dentistry platform bolted onto a DTC business model, you might think of it that way. But the main idea is that orthodontists are no longer the gatekeeper. So with Align, Align owns the brand that consumers ask for, but the orthodontists still keep the customer relationship, whereas in this DTC model, Smile Direct owns the customer relationship while orthodontists are kind of shoved to the back, where they’re just reviewing the cases.
This is kind of like the next phase of counter positioning. So in part one Align, counter position against the traditional wire and bracket incumbents by creating a consumer brand around this new aligner technology. And then now here’s Smile Direct and all these other guys counter positioning against Align by selling direct to consumers. This is something that Align will find very hard to copy because of channel conflicts. So Align has struggled with channel conflicts in the past. When they first launched, Align just targeted orthodontists but they were sued by dentists who thought it was unfair that only orthodontists got the product and they thought they should be able to have it too.
Align then figured if they’re going to sell to GPs anyway, they may as well proactively do so. And I’m just speculating here, but it could be that that was one of the reasons why Orthoclear stole so much share from Align back in the day. Align’s second misadventure with channel conflicts came a few years ago. They bought a 19% equity stake in Smile Direct and then agreed to supply Smile Direct with aligners. And soon after they did that, Align opened these freestanding showrooms where they could provide consultations to consumers. And what they told orthodontists was that this would be good for them because Align would funnel traffic their way. Nobody bought this. Everyone like saw through the ruse. This was clearly an attempt to go DTC.
Doctors were furious, SmileDirect sued them and Align was forced to retreat. So anyway, the direct to consumer model proved very popular with clear aligners and heading into COVID, Smile Direct was growing like a weed. They did close to $700 million in aligner revenue in 2019 and they were really only around for five years up to that point. To put that in perspective, it took Align 16 years to approach that level. So Align basically created this clear aligner category and then Smile Direct found a way to piggyback on that with a different distribution model at a much lower price point. Align will run a consumer somewhere between $4,000 to $8,000 whereas a Smile Direct case will go for 1,800 or 1,900 bucks or 2,300 bucks if you use financing. So it’s a massive, massive cost savings.
So I talked about all the things that Align vertically integrates…the CAD, the scanners, the manufacturing. Well Smile Direct also does manufacturing and it has its own proprietary software, but it takes things to the next level in that it leases the stores, it handles the customer service and it provides installment loans to customers to pay for the product. Basically the cost that an orthodontist would typically bear to run a practice, Smile Direct is putting on its own income statement, right? So they’re doubling down on vertical integration in the hopes that by doing so they can offer a better customer experience and then get the volumes to realize scale economies.
You can start with counter positioning but eventually you’ve got to work your way up to scale economies.
I’m not saying anything new here, but these DTC businesses, they’re easy to start but hard to scale. And so right now, this vertically integrated approach means that Smile Direct is burning lots of cash. So in 2019, before COVID, they generated negative $440 million of free cashflow on revenue of $750 million. And it just seems like this process of getting to scale is like getting harder over time. Like a decade ago when Dollar Shave Club and Warby Parker were coming up, maybe you could just throw money at Facebook and Instagram to acquire customers at attractive ROIs, but then that gradually got competed away. And these DTC brands had to find other ways to boost conversion by pulling levers in other parts of the funnel. In many cases that that meant going as far as opening stores.
So now we’ve moved into this next stage of DTC where the conventional wisdom has become “rent is the new CAC”, right, where you complement your online presence with stores. So that’s part of the playbook now. And I feel like Smile Direct has had to emphasize brick and mortar especially because it faces some unique challenges with clear aligners. Because in the online delivery model, they have to ship you the PVS stuff, and it’s up to the consumers to take their own impressions and this just isn’t a great experience. And in fact, one of the key reasons why they opened stores in the first place was so that customers could get the digital scans instead.
So you think about all the steps here: you need to ship the PVS to the consumer’s house; the consumer has to feel confident enough to like take their own impression – that’s something that’s usually done by a dental assistant – and then they have to mail that back; and then an orthodontist has to see if you’re a candidate and then Smile Direct has to come up with a treatment plan. So, I mean, there’s a lot of friction there and a lot of places where a potential customer can fall through the cracks. They opened the stores in part to keep prospects in the funnel, but I think maybe Smile Direct went too far with this. They had around 400 units and those stores were like 25% utilized heading into the pandemic. They’ve had to dramatically pare back their footprint. I think they originally thought the stores would serve as a customer acquisition vehicle but what they discovered pretty soon was that for the most part, the stores were just being used as fulfillment.
Fortunately for them, 40% of their stores were through CVS and Walgreens where they’re basically on a revenue share agreement and they’re not paying the fixed cost of rent. And then also most of their leases were month to month. So they’ve let those leases roll off and I think the plan is to just walk away from the stores. Now they’re thinking that patients will be willing to drive a little bit further to get to a Smile Shop. The other thing they’re doing is partnering with dentists. So this is a partnership model where dentists take the scan and then share the revenue. They have like a thousand dental practices now participating in this network. So it seems like they’re emphasizing the traditional channels for customer acquisition. In some ways, it kind of validates this idea that online direct to consumer is really just a starting point. It’s not the end all and certainly not a moat. It’s just a way to find customers and get initial traction.
I think these are the right moves because realistically I’m not sure that having consumers like take their own impressions is a model that works long-term. During COVID, Smile Direct shut down their stores and what we saw then was that like the online channel just couldn’t pick up the slack. So if you look at aligner shipments in the last nine months of 2020 for Smile Direct, those were down like 27%, whereas for Align the case shipments were actually up 9%. So short of sending everyone digital scanners, I’m not really sure how you solve for that problem.
Smile Direct has the added challenge of regulatory capture. So you have dental and orthodontic trade associations arguing against tele-dentistry for orthodontics saying that Smile Direct is shirking the standard of care by not having doctors perform patient exams. And the dental boards in Alabama and Georgia have passed rules that said a doctor needs to be on premises when a 3D scan is being taken. But this is increasingly a moot point because Smile Direct is partnering with dental service organizations and they’re covered in network by more and more insurance carriers. So it feels like they’re being validated by important parts of the value chain and more generally, I just think fighting against teledentistry or like tele-anything is just a losing battle because COVID has normalized it.
And I think that sentiment and regulations around telehealth are definitely changing for the better. So, yeah, this feels sort of like one of those Uber versus cab drivers or Airbnb versus hotels cases where like if the product is so much more convenient and affordable and consumers are really asking for it, the ecosystem will adapt and the regulations will eventually accommodate. That’s kinda my opinion. But that’s not to say that Smile Direct, isn’t playing with fire a little bit here. I think Smile Direct is fine for simple cases, but you probably don’t want to be stepping too far outside of your technical capabilities because, like moving molars can change the bite and that can have long lasting impacts. It honestly wouldn’t surprise me if Smile Direct we’re we’re biting more that more than they could chew here.
But that needs to be offset by like all the good they’re doing by making orthodontia affordable to so many people. I mean, the way things are today, whether you have a complicated case or an easy case, it really doesn’t make that much of a difference in terms of like what an orthodontists will charge. It’ll still be like 4,000 to 6,000 bucks. So here’s smile direct coming in at less than $2,000….all things considered, I think that’s probably a net positive for consumers, even when you take into account the possibility that they may be doing cases outside their technical capabilities.
But I’m not really sure what would lead me to say that Smile Direct is the one to bet on versus all the other DTC aligner companies, maybe other than the fact that it has a lead on its competitors when it comes to vertically integrating the manufacturing.
And I alluded to this earlier, but there’s really nothing special about the online channel per se from a competitive advantage standpoint and asking like how an online DTC company succeeds is really not that much different from asking how any retailer or any brand succeeds….like the answer is not going to be found in a generic channel strategy. Casper likes to say it’s their data science and marketing skills and they like to pitch this narrative of not being a mattress company but rather a sleep experience company, meaning we don’t just sell mattresses but also pillows and pajamas. And then Smile Direct seems pretty good at this stuff too. It’s like, we’re about better smiles, meaning we don’t just sell clear liners, but tooth whitening and power flossers.
So yea, there’s something to say about consistent messaging and branding, but also realistically these companies have to define their value prop more broadly to make like their economics work. So I think at one point Casper claimed that historically they were able to bring in $3 of revenue for every dollar of marketing spend, but you know, their gross margins are like 50%. So $1.50 on a dollar of marketing, that’s not great, especially when you consider customer support and other costs. So yeah, they probably need to attach more and more products in order for the unit economics to make sense. And maybe the same is true of Smile Direct, although Smile Direct has much better gross margin.
I don’t know. What I will say though is it’s a lot easier to imagine how scale economies develop than it is to call the specific winners in advance. Align was also burning tons of cash as they tried to gain adoption and it took them nearly 10 years after they launched to start consistently generating profits. And then obviously they spooled up the scale economies over time. And the bull case here is that Smile Direct could pull off a similar result. Because look, first they have pretty good brand awareness now and second, it’s a really compelling value proposition for consumers. Like the treatments are so much cheaper than Invisalign.
And here’s the other thing: consumers don’t actually know the difference between a good enough smile and a perfect smile, and they may not actually care in most cases. Smile Direct may not meet an orthodontist’s exacting needs for these comprehensive cases, but it might be good enough for the vast majority. And in fact, Smile Direct says up front, the goal is not to produce a perfect smile but just to make your smile better. So you can imagine a scenario where the low price point attracts volumes, they scale the manufacturing, they bring down their unit costs, which allows them to reinvest more aggressively than peers in customer acquisition, which brings in more consumers, which brings in more doctors to their network reviewing the cases, which means faster turnaround times, which in turn creates a better experience and draws more customers, more opportunities to cross sell toothpaste and night guards. So there are like these reflexive properties to scale. The second ingredient to this – and this isn’t specific to Smile Direct necessarily and it’s maybe a little bit more speculative – but I think there’s like this feedback between like capital and success, where to pull this off, you need a vertically integrated model, which means you need to raise more capital to absorb your burn until you get to scale.
And that money will flow to whoever capital providers think should win and will win in the category. There’s this self-fulfilling prophecy in a way where the people with the money are not just like finding the winners, but also anointing them. And they do so based on like who’s already winning because success breeds success given the scale economies and it feels like right now that player in DTC is Smile Direct. So they have pretty dominant share in that channel I think. And for now I think they’re the only ones vertically integrating the manufacturing. But I’m sure others will follow suit and yeah, the markets have just been super accommodating, so like Smile Direct’s cash burn really just hasn’t mattered from like a survival perspective. They secured a $500 million credit facility. They did a $650 million convert and that $650 million was upsized from $350 million. And this was like zero coupon, 40% out of the money. So, I mean, it’s kind of incredible the terms on which some of these companies are raising capital.
So switching back to Align, as far as I can tell most of the competitive impact – whether that be from do it yourself 3D printers or from direct to consumer – has been limited to the low end of the market. And whether competition is having an impact on Align’s numbers today, it’s sort of ambiguous. Like their ASP’s have been trending down for years….that could be pricing, but it could also be a mix issue because the less complex cases have also been growing. Or it could be like doctors getting volume discounts for ordering more cases. There’s also an accounting dynamic to take into account because part of the revenue is deferred if you use extra aligners and that can lead to a case where you’re selling these lower priced cases but those could show up as higher ASP just because you’re recognizing revenue faster.
Same thing with gross margin. Gross margins for the Aligner segment have been trending down for years, but even here, that could be pricing and competition but it could also be manufacturing costs being front loaded or volume discounts. I don’t think that management has really explained what’s going on there very well. But if the orthodontists are forced to take their prices down to match Smile Direct, the scenarios I think play out here are either: one, the orthodontist eats the lower prices, even as they continue paying Align what they did before; two, Align takes the margin hit. So Align charges lower prices to the doctor so that the doctor can maintain their unit profits; or three, Align has to find other ways to save the doctor money by helping them to do these cases more and more efficiently.
And I think probably all three of these factors are at play to varying degrees. But yeah, so on that third point what you’ve seen over the last year as Align is trying to help doctors save time. So they’ve rolled out a tele-dentistry platform where patients can make virtual appointments. They’re embedding more AI into this platform for virtual case follow-ups. And they’re rolling out this business consulting service to help GPs and orthodontists digitize and streamline their workflows. And they’ve had to accelerate this because of COVID, but I think more generally they’re launching these time-saving tools so that doctors can handle more cases and then preserve profitability that way.
But Align is in this position where they can handle more cases than anyone else today, but there may be a disruptive process going on where these competitors get better and better until like they’re functionally good enough and while Align is definitely the low cost producer of these aligners that’s not to say that their margins can’t be competed down from 25% to 15% or wherever. And yeah, I just see the competitive environment is getting more intense, not less intense, and this competition is coming from places that Align isn’t really set up to compete effectively against for like all the reasons I talked about. And that’s not to say that Align doesn’t have a lot of great things going for them, but you just have to be pretty confident in the growth opportunity and the moat when paying 80 times pre-COVID EBITDA for a $40 billion company.
So all right. That’s all I got to say about this. Thanks everyone for listening and for all your support and encouragement. It definitely means a lot and I greatly appreciate it. Okay, have a great week.
interview with @LibertyRPF
Posted By
scuttleblurb
On
In
Business updates,SAMPLE POSTS |
No Comments
I recently did an interview with my friend @LibertyRPF[3], who publishes an insightful newsletter[22] covering tech, science, investing, and various other topics. It is one of my morning staples. You can access the original interview here[23].
Q: Hey David! It’s been a little over a year since we last did this [see 𝕊𝕡𝕖𝕔𝕚𝕒𝕝 𝔼𝕕𝕚𝕥𝕚𝕠𝕟 #𝟙 for our first interview[24] -Lib], I’m sure a lot has happened in the interim, but first, how are you? How are Zoe and Riley[25], the newest members of the ’blurb family?
Hey Liberty, the twins and I are doing great! Thanks for asking.
Q: A lot of people have joined the newsletter game in recent times. What I’m curious about is, as one of the Granddaddies of the genre, at least when it comes to the financial deep-dive sub-genre, what are you noticing when it comes to having longevity in this game?
What stuff are you finding out in year three and four that you wouldn’t have easily guessed early on? What are you doing differently now, or want to change going forward?
For the first few years, I was just trying to get on the radar. I didn’t know about Twitter so, like a savage, I sent personalized emails and handwritten letters with sample posts to money managers who I thought would like my work. You, @BluegrassCap, and several others tweeted my blog and pulled me into modern times. Scuttleblurb spread through word of mouth among the much-larger-than-I-imagined subset of fintwit that cares about fundamental research, which set the conditions for huge growth in 2019 and 2020. But last year, I stopped engaging and focused near-exclusively on my work. What little podcasting and Twittering I did in prior years ceased almost entirely. Reclusive behavior, combined with the explosion of competing newsletters, had a predictably stultifying effect on growth. My subscriber base flatlined for most of last year. I’m frankly surprised (and relieved) that it didn’t shrink.
I guess the super obvious takeaway here is that if you want to grow it’s important to stay top of mind through regular, substantive Tweets and podcast appearances (voice tightens the bond). Ideally, you want your newsletter to be part of a subscriber’s daily routine, something they peruse while sipping morning coffee. I know Ben Thompson’s Stratechery occupies that privileged slot for many of us. But that’s not a realistic aspiration for a deep dive writer like me who only publishes once or twice a month and doesn’t offer takes on the biggest, most topical news stories of the day.
The explosion of content has changed the way readers engage with it. Most people, including me, will flip through one essay after the next like nothing, oblivious to all the hard work and creativity that went into it. Some will cancel their subscription if they have to waste even 5 seconds logging in to read a 5,000 word post. “Too much friction”. We are spoiled with great content. I personally subscribe to over a dozen newsletters. Most sit in my inbox unread. Sometimes my auto-renewal receipts remind readers to cancel as they realize they haven’t gotten around to reading my posts. This has been happening to me with greater frequency.
“Fluff” is also friction, avoid fluff, of which there are two kinds (I’m guilty of both at times). There’s the stylistic kind where you overwhelm the reader with jargon and needless sentences. And then there’s the more insidious content-specific kind where you don’t make a meaningful point. A nice trick here is to ask yourself if any reasonable person would agree with the inverse of your claim. If not, then is your claim worth making in the first place? “We strongly believe that the best companies have durable competitive advantages, innovative cultures, and are managed by aligned founders who strive for non-zero sum outcomes”. That’s motherhood and apple pie. I have yet to come across an investor who argues for narrow moat enterprises with torpid cultures led by rapacious hired guns.
Q: There seem to be very strong forces that pull many writers out of the field. By that I mean that a successful newsletter is a great resumé, and many of the writers I know have gotten very appetizing job offers.
I feel like there’s probably only a relatively small subset of newsletter writers who truly want to write as an end goal — writing is thinking, and thinking is hard — and many others who are doing it to build towards something else. So over time they leave and it may be possible for the few that just keep on going to kind of be the last people standing through sheer longevity. I guess I’m just curious if you have any thoughts on this dynamic..?
I think you’re right – the industries where folks will pay good money for informed newsletters are also those in which writers are least committed to newslettering as a profession. Lots of folks go into finance/investing for money and prestige, and compared to managing capital or working at a hedge fund, writing a newsletter can seem like a big downgrade on both dimensions. I think this is less true than it used to be. Ben Thompson legitimized newsletter writing as a profession in so far as he showed you could earn a nice living by offering thoughtful analysis, without pumping stocks. But when I launched scuttleblurb in late 2016, more than a few well-meaning folks felt my career was moving backwards. And it’s not like my newsletter motives were “pure” either. My fund didn’t start with anywhere near the AUM to earn a sustainable living. Scuttleblurb was an attempt to generate steady income in a manner that was synergistic with managing money.
There are many more finance-interested people who want to work at or start funds than who want to write for a living….but I think those in the former camp increasingly realize the complementary value of publishing a Substack or Revue. For those trying to land an analyst job, there is no better resume than a record of your investment writing. A blog is a canvas to showcase creativity, analytical skill, passion and intellectual honesty. For emerging managers, writing is an excellent way to attract and screen for the right partners. An allocator who has read your work over the course of a year will have a clear sense of what you’re about before they reach out. It saves time on both sides.
Every so often on Twitter I’ll see someone say “if newsletter writers were any good they’d be managing money” and I always think “great, when can I expect your wire?”….as if raising capital is the easiest thing in the world. At least for me, finding aligned partners has been a long process. Getting to scale took over 5 years, it came all at once, and there are a million scenarios where I make the same moves and things don’t work out. Just because someone isn’t managing money doesn’t mean they aren’t capable of doing so. Plus, some analysts just don’t want the stress of managing outside capital. Why diminish those who take an alternative path or don’t share your life choices and goals? Isn’t it better to have thoughtful analysts out there publishing their work than not?
Q: What do you love most about this job? What part of it are you most excited about, or do you feel is most rewarding?
Definitely the money. This work feeds my family. The inspirational stuff around community, intellectual challenge, non-zero sum knowledge sharing, etc. applies of course. But this project didn’t start with high-minded aims. It started with me stressing out over how I was going to earn a living as I burned through my limited savings and struggled to launch my fund. It started with me publishing into a void and thinking I was not gonna make it. So to now have ~1,500 readers expressing support with their hard-earned cash is insanely rewarding.
Q: What do you dislike most about it? If someone told you they want to do what you do, all starry-eyed and optimistic, what warnings would you give them to make sure they know what they’re really facing out there?
There are so many newsletters competing for attention. For every successful newsletter writer, I’m sure there are hundreds more who never gained traction, not because they weren’t talented but because it’s just really hard to break through all the other terrific free and paywalled stuff out there.
If you’re thinking about starting a newsletter anyway, I would fantasize less about success and ruminate more on whether you will actually enjoy the day to day experience. Writing for a living has a certain romantic appeal, but it is a solitary endeavor that can feel like a slog for someone who does not intrinsically enjoy reading, thinking, and writing for hours on end, day after day. This job suits my personality. I crank Zeppelin and lose myself in the work. But it’s not for everyone. Some people don’t like Zeppelin. (a little dad humor for you Liberty 😉 [Ha! You know me so well! 🤓 -Lib]
Q: Last year in our interview, you wrote about your research process. I’m guessing it’s not something that changes a lot, but I’m curious if you’ve learned new tricks or changed anything since?
No, not really.
Q: Or if you’ve changed your views on anything important when it comes to your investing? Any companies or industries that you know little about, but feel like are holes in your knowledge, and you’re looking forward to digging into in 2022?
I think young fund managers, and I’ve been guilty of this too, have a tendency to over-intellectualize and complicate investing. Some of this is theater. To stand out and appear deep, one quotes Marcus Aurelius and draws facile analogies between physics and investing. By comparison, wisdom from experienced veterans can often appear trite and simplistic. But I’ve come to believe that that’s often because they’re done trying to impress. They recognize that investing is not about complex theories, superficially applied but rather basic insights, deeply absorbed. It’s that classic Charlie Munger line: “take a simple idea and take it seriously”. This is an old lesson I’m relearning. It didn’t stick the first time.
Great companies really feel this in their guts. Old Dominion Freight Lines, Sherwin-Williams (long), Fastenal, and Charles Schwab (long) are organizations that build around simple drivers of value creation. For instance, while the LTL industry embraced “asset lite” dogma, Old Dominion invested in the service centers and trucks required to offer reliable on-time service at a fair price (not the cheapest price). The profits it realized from winning share and scaling its fixed cost base were reinvested into still more service-enhancing capital investments, driving still more profitable share gains.
Twilio obsesses over developers. CEO Jeff Lawson’s 300-page manifesto testifies to this. The company is made up of Amazon-inspired multi-disciplinary “two-pizza” teams who can respond to customer needs with the agility of a startup. As they grow past 10 members, those teams split into smaller ones, with the code base divided at each mitotic [Good vocabulary! -Lib] phase so that technical debt is paid down as the company grows. All employees are required to spend time supporting customers and building software with Twilio’s APIs.
This isn’t always feel-good stakeholder capitalism stuff and there is sometimes more than one viable vector of attack. Airbnb and Booking (long) are, to borrow a phrase from William Finnegan[26] (Barbarian Days), the “oversold thesis and understated antithesis”. Booking quietly games the mechanics of performance marketing and conversion through maniacal experimentation. They’ve systemized the process more than any other OTA, with a team dedicated to maintaining the tools and scaffolding that allow anyone in the company, including new employees – who are, by the way, trained on statistics and hypothesis formation when hired – to launch experiments without permission. To pull this off, you need a culture that runs flat and encourages frequent (but small) failures.
Airbnb is equally ambitious but crunchier. They built the most resonant brand in this space by taking community, connection, and product seriously. That Airbnb commands ~the same enterprise value as Booking on ~half the gross bookings and none of the profits is at least partly a function of vibes and storytelling: it’s easier to dream big with Airbnb than with Booking because CAC can be framed as intangible asset investment that should scale better than a recurring Google toll, and the company’s granular inventory molds better to all sorts of use cases and economic environments…though whether one is justified buying into this vision has yet to be seen. Back when Booking was at Airbnb’s 2019 level of gross bookings, it grew faster and delivered +37% EBITDA margins vs. -7% for Airbnb. Anyways, I guess the point is I tend to emphasize strategy when sometimes what really matters is that a company knows, like really knows deep in its marrow, what it’s all about and does uniquely well, top to bottom, things that are consistent with that identity.
Besides “culture”, something else folks talk about is incorporating base rates into the investment process. This sounds like good hygiene, but I find it hard to apply and even easy to misapply in practice. I once listened to a podcast interview, this was maybe 5 years ago, where the guest chided a sell-side analyst for modeling Amazon’s annual revenue growth at 15% for the 10 year period from 2015 to 2025, retorting (and I’m paraphrasing somewhat): “If you look at the top 1,000 US companies since 1950 that started with $100bn in revenue, not a single one grew 15%+ per year over the subsequent 10 years.”
I’m reminded of that classic Monte Hall game[27], where a prize lies in one of 3 boxes. You pick Box A. The host, who knows which box contains the prize and is tasked with opening a prize-less one, opens Box C. Do you switch from Box A to Box B? Yea, sure, because in picking Box C, the host conveys information that suggests it is more likely that the prize is in Box B. That’s just Bayesian updating. But now imagine the same setup except this time the host randomly opens Box C. Here there is no advantage to switching. In both scenarios, the observation is exactly the same: the host opens Box C; there is no prize inside. But whether you, the contestant, are better off switching hinges on whether the host knew which box held the prize and opened an empty one. To paraphrase Judea Pearl, the process by which an observation is produced is as important as the observation itself.
That “no $100bn companies since 1950 have grown revenue by 15% over a decade” may be an empirical fact, but it doesn’t take into account the process by which Amazon (long) got to where it is. The speed and intensity with which online businesses scale is unlike anything we’ve seen in the Age of Oil, Automobile, and Mass Production (h/t Carlota Perez) and it seems misguided to anchor to pre-internet statistical artifacts. It’s proper to start with the “outside” view and adjust according to local information about a company’s competitive positioning, addressable market, unit economics, etc. Too many investors get swept up in company-specific narratives and ignore broader context, that’s true. But I’ve also found that those who tsk-tsk with “no company has ever…” finger-wagging often frame against the wrong context and tend to downplay updating or don’t possess the company-specific knowledge to understand how significant that updating should be.
If you’re walking through the woods and happen across a lizard reciting the alphabet and your friend asks whether it can vocalize words, you don’t reply “the base rates don’t look good; no reptile in existence has ever uttered words”. No, first you wonder about the mushrooms you picked earlier, but then you say “holy shit, this lizard knows its ABC’s!” Not a great analogy, but you get my drift. [🦎 -Lib] That Amazon, like no other private enterprise, got to $100bn of revenue in 20 short years and was still growing close to 30%/year off that huge base is an indication that there may be something special going on here, that perhaps the idiosyncratic merits of this situation demand major updating of base rate priors. The same could also have been said of Google, also a member of the ~$100bn club, growing 20%+. Rather than cling too firmly to historical base rates, it seems more useful to ask what’s different about Amazon and Google, and to then consider the consequences of that answer. Statistics aren’t explanations. Data doesn’t speak for itself. Without a qualitative understanding of how a company creates and captures value, you don’t know why the numbers are what they are or what might cause them to break down or inflect.
Q: I know it’s hard to judge one’s own work, but I’m curious if — looking back on Scuttleblurb since the very beginning — you could share what you think were some of the high-points and low-points when it comes to your analysis. Any standouts where you think, “this really aged well, I got it right there” or “oops, I think I screwed up there for reason XYZ”..?
Like 2 or 3 years ago I wrote a few posts about how private permissioned blockchains might have some interesting business use cases… for instance, in simplifying the process of transferring land titles, counting proxy votes, and recording share ownership, tasks that are today are processed through byzantine methods subject to uncertainty, delays, and costly errors. I saw blockchain as being more about efficiency than revolution, a way to handle pedestrian record keeping tasks more transparently, at lower cost and greater accuracy. I acknowledged that there were major institutional barriers to adoption, but nevertheless thought we would be talking more about corporate blockchain today.
But enthusiasm around this stuff has waned. Today crypto ideas are more philosophical, more self-referential, less obviously and immediately useful. Remember when, to sound smart, people used to say “I’m skeptical of crypto but blockchain is interesting”? They don’t say that anymore. The party around crypto assets has drowned out staid corporate conversations around blockchain as a record keeping technology. The talk these days is more around leveraging crypto incentives to organize people for…blah…whatever, yacht parties, climate change. I pine for the days of Long Island Iced Tea Blockchain. It’s not clear to me if it is decentralization or the hype around decentralization that is doing the heavy lifting here or if it even matters. I offer no opinion on how much of this is good or bad, and have less than zero desire to defend any side of this holy war. I only mean to say that things have played out much differently than I thought they would…but of coursethey did.
I was much too enthusiastic about Twitter (long) and overestimated the pace and impact of some of their product initiatives. At first, it was almost endearing to see Twitter stand and fall (“c’mon Twitter buddy, you can do it!”) while Facebook won its nth Gold medal. But after so many years of missteps, now we’re all worried about degenerative bone disease. They’ll likely miss DAU guidance. Expenses are off kilter. Creator products were slow to launch and remain janky. Investor sentiment is terrible. Twitter’s enterprise value is about where it was in 2018/2019.
But – and here’s the part where I get booed offstage – the company is in a much better place today than it was back then. They are experimenting with new products and acting with way more urgency than they have in prior years. They’ve made it easier to onboard, proposing to users a growing selection of Topics rather than requiring them to build interest graphs by piecemeal following individual accounts. Recent and pending product launches – Spaces, Private Spaces, Revue, Super Follows, tipping, etc. – have the potential to better engage and retain users.
It’s hard to exaggerate how bad things were on the ad side. Twitter was an interest-based graph that didn’t track your interests. It would show ads based on who you followed and the ads you engaged with in the past. Hobbled by a dilapidated tech stack, Twitter would take months to roll out new ad units. But having just devoted the last 2-3 years splitting its ad server functions into separate sandboxes, the company is now developing and launching new ad formats at an accelerated pace.
Twitter won’t ever rival the “always-on” direct response dominance of Facebook – they have relatively limited data and the text-centric nature of its platform may not lend itself as well to certain visual categories. And compared to Facebook, Twitter doesn’t have near the expertise to deftly maneuver around ATT constraints. But it can certainly be a much stronger complement than it is today. The idea is that with user-side initiatives like Topics and Communities[28] producing sharper signals, Twitter will bring a more targeted ad product to the episodic brand advertising – creating buzz around products launches, drafting off cultural moments – for which it is uniquely well-suited, as well as crystalize durable interest clusters for the long tail of smaller advertisers to DR-advertise against.
In short, Twitter is tying users to interests, which generates more targeted data for advertisers, who now also have access to a more user-friendly back-end from which to launch better converting ad formats. This is one of the most socially consequential information networks on the planet and the business is improving off a very low performance base. But man, enough already, right? This year, Twitter needs to demonstrate that its simultaneous user and ad-side efforts are bearing fruit. C’mon Twitter buddy, you can do it!
In my Zillow post, I took for granted the basic operational and blocking/tackling aspects of iBuying. When looking at the world through a strategy prism, you can sometimes lose sight of obvious ground level realities. I thought Zillow’s brand and traffic gave it an advantage in acquiring and turning over inventory, and that it could monetize rejected iOffers as highly qualified seller leads. But obviously, none of that matters if you’re recklessly buying market share at any cost and betting on home price appreciation to bail you out!
It’s not clear to me that iBuying is an inherently broken model. Opendoor seems to be doing fine, reporting strong unit margins even as they continue to expand the buy box. Zillow discarded underwriting discipline in a rush to grow. It may even be that Zillow’s existing assets and revenue streams – brand, mortgages, escrow, title, agent network – were in fact liabilities in so far as iBuying conflicted with agent lead gen or the company thought it could be a bit sloppy on iBuying because they could make up for it in other ways. Opendoor, on the other hand, had to be much more assiduous about forecasting home prices, monitoring repair costs, and otherwise managing risk because there was nothing else to fall back on. Getting the basics wrong would have had world-ending consequences for them.
But if iBuying is a viable model – “if”, because this model hasn’t been tested by a bear market and it’s unclear how much extra rake can be pushed through or how many ancillary services can be cross-sold to offset negative HPA – well, that puts Zillow in a tough spot since one of the reasons they got into iBuying in the first place was because they saw it as an existential threat to their core lead gen business. For that reason, and given Rich Barton’s propensity for shaking things up, I suspect there’s probably another BHAG in the hopper, maybe on the institutional side of things. Zillow has this amazing top-of-funnel asset that you’d think they’d be able to monetize in a big way, though I guess people have been saying that about TripAdvisor (and Twitter!) forever too.
Anyway, I could go on and on. Every one of my posts has these kinds of blind spots and shortcomings. But on the whole, I’m happy with my work.
Q: Normally I’d ask you about how Scuttleburb has been doing in the past year as a business, but you’ve published a business update at the end of December, so I’m just going to link it here:
First, while I detect a melancholy tone, I gotta say that I find what you’ve built with only your words extremely impressive, with revenue going up 15x since 2017 (and in this business, revenue and profits are fairly close if you’re a one-person-orchestra).
It’s interesting how the psychology of momentum works, and how our brains tend to extrapolate whatever has been happening recently forward. If your subscriber graph had been going up in a straight line from 2017 to 2021, it would probably feel really good. But because it’s been plateauing lately, it doesn’t feel nearly as good (even if the next phase eventually turns out to be more growth — time will tell). I think it’s important to zoom out. You’re a guy sitting at home in pyjamas, typing stuff into the computer, and you’ve materialized through sheer persistence and intelligence a community of customers that would fill a decent-sized concert hall. Kudos!
I guess this isn’t really a question, but I am curious what you think about the ups & downs of being a solo creator, and how the psychology of it plays out.
Thanks for that. I didn’t mean for the letter to come across as melancholy or pessimistic. When I say “subscriber trends look weak” and that I’m “fading somewhat amid the scrum of new talent”, well, those are just the plain realities. Acknowledging the realities doesn’t imply that I am sad or frustrated by them or hope for something better. If my subscriber count stayed flat from here on out, that would be a fantastic outcome. I just don’t want to shrink to unsustainable levels. In 2020, my annual churn was 14%; in 2021, it jumped to 26%. I think I’m still in the safe zone, but the trend isn’t great and I can’t be having like more than half my subscribers leave every year. At some point I’ll have cycled through the addressable fintwit TAM. But beyond the income threshold required to sustain my modest lifestyle, send the girls to college, and save for retirement, I don’t really care about growth. I care a great deal about doing quality work though. I think it was Ira Glass who said that at some point you get good enough at your craft to know what great looks like and it can be disappointing not to live up to that standard. I feel that sometimes.
Q: Were any of your posts from the past year particularly difficult to research, or that you learned a lot from..? Maybe things that unexpectedly went pear-shaped, like Everbridge, and how you analyzed and scuttlebutted the situation to figure out the odds on what was going on?
Hm, I don’t really have pivotal moments where everything locks into place. For me, synthesis is a gradual process. TV shows and movies emphasize silver bullet events – Bobby Axelrod lays down a big hero bet after finagling a key piece of information.
Reality is far less exciting. What really happens is you build muscle memory about a company and its ecosystem over years and calibrate conviction along the way. That’s why I would caution against buying after a first deep dive. Research should be exploratory, not confirmatory. The idea is you don’t know if the stock you’re researching is as good as you think it is at the start, but it’s very easy to convince yourself that it is just because you’ve devoted so many of your waking hours to it this month. There is a Dunning-Kruger effect at play where because you don’t know how little you know, you deceive yourself into thinking you understand more than you do….until the stock sells off by 30%. Then your hands turn to paper.
Q: Anything else you’d like to share? What did I forget to ask about?
No, except that nothing I’ve said in this interview is investment advice and I can buy or sell any of the securities mentioned at any time. Thanks for the thoughtful questions!
Q but not a Q: Thanks man!
Interview with Mirakle
Posted By
scuttleblurb
On
In
Business updates,SAMPLE POSTS |
1 Comment
A few weeks ago, I did an interview with Mirakle, a Korean language business newsletter (link[30])
Below is the English version:
Thank you so much for the opportunity – My first language is not English and although I have learned English for 6 years in regular school system in South Korea, my written English may not sound clear to understand
No worries. I promise my Korean is far worse than your English
I learned how you started newsletter writing (at here link[31]) and how you were picked up by Twit community – That is quite amazing story – The idea that researching and writing only can make your living would quite resound to my audiences – How do you appreciate your current position now? How satisfied are you and your family on what you are doing?
In 2008 Kevin Kelly wrote this essay, 1,000 True Fans[32], that basically talked about how, contrary to the prevailing belief that grabbing the attention of millions was required to earn a living online, an independent creator need only find a relatively small number of “true fans” who were willing to pay for their work. This was nice in theory at the time – the internet made it possible for any normie to broadcast their creativity to the world – but tough to realize in practice because how does one find those fans? Social media supplied part of the answer. A blog dedicated to an arbitrarily niche interest can resonate with a likeminded group on Twitter. That group can be far larger than what narrow personal day-to-day experience might lead you to expect as there are more than 200 million people engaging with that platform every day, and even a thin sliver of that population can translate into a meaningful audience for a single creator. I set an aspirational goal of 200 subscribers when I started. That close to 1,500 readers would pay ~$210 a year to read a blog written by an unknown analyst would have seemed far-fetched at the time, yet here we are.
You no longer need to be affiliated with an established media outfit. New independent writers are making good money covering niche topics with far greater depth and insight than traditional media (I’ll take my work, or that of Mostly Borrowed Ideas[33], TSOH[34], and Yet Another Value Blog[35] – other terrific independent writers in my genre – over the cursory stock pitches published in Barron’s any day). There are even trusted independent curators, like The Browser[36] and Liberty’s Highlights[22], to help sift through the sea of content. This is not to diminish the ground level reporting and assiduous fact checking that large publications put into major news stories of broad public interest. That is important and noble work. But the explosion of independent newsletters is great for those who enjoy long form analysis on niche topics.
Of course, working for yourself on things you find interesting has widespread appeal, and with Substack and Twitter eliminating what few entry barriers there were in launching a paid newsletter, the competition for readers has exploded. My particular domain – analyzing competitive advantages and business models – seems to get more saturated by the month. After a certain point, growing a subscriber base requires more than just good content. You need to get out there and actively engage through Twitter threads, Spaces, podcasts, etc. But I don’t think of scuttleblurb as a business and have never been interested in growth for its own sake. I’m not trying to build the largest possible audience. So long as this blog brings in enough to provide for my family, I’m satisfied.
If I were in your position, I would be bombarded with the inner-mind tension between writing something that I only found out to broader people and investing something that I only thought would increase its value for broader people – writing and investing for others – what does interest you more? I learned that you have dipped your feet into both choices and assumed that you might give us more insights.
Frankly, I didn’t set out to be a writer. Scuttleblurb was a means to an end. I needed a way to cover expenses while I scaled my investment business, so I figured I’d post my research online and see if anyone would pay to read it.
Writing, for me, is a selfish act. Besides putting food on the table, it makes me a better investor. It puts structure to thoughts and stops me from fooling myself (a good way to test whether you really understand a concept is to explain it to others). I also find that the very act of writing can open creative outlets and trigger new avenues of exploration. My coverage isn’t influenced by what I think my subscribers want to read. I just write about companies that interest me and hope others come along for the ride.
Most of people who do investing in remote companies from countries like South Korea often feel it to be difficult to know more about the stocks that they want to invest. For them I think your ways to approach companies could have interesting implication – as you are individual researcher who might not have ample chances to participate fancy IR events that companies are holding. Can you share your routes to corporate information and if you have any advice, can you please share?
You might be surprised how far you can get with just an internet connection. Publicly traded companies in the US post their annual and quarterly reports, earnings calls, and investor presentations on their websites. Their Investor Relations departments will often speak to individual investors. You can reach out to former employees and competitors on LinkedIn or to industry folks who publish or are quoted in trade publications. The hit rate is low, so you need to be scrappy and persistent, but it’s certainly doable. Just don’t waste people’s time. Put in enough work to ask substantive questions and be willing to share what you’ve learned as well.
Keep in mind that sound investing has as much to do with judgment and synthesis as it does information gathering. Do enough of these calls and you’ll realize that everyone is blindfolded and touching a different part of the elephant. Part of an analyst’s job is to weigh to different perspectives and roll them up into as accurate an understanding of the company as you can. Saying you’ve spent countless hours doing this many calls is a quantifiable measure of progress. By contrast, synthesis, dispassionate analysis, and resource management are somewhat abstract skills, not something you can really brag to allocators about. But the lens through which you interpret information and how you balance your time across different opportunities are so important.
I once heard an investor say that they take research on a company to the point of diminishing returns…and then push even further. But there are some downsides to this impressive-sounding rigor. The world is an unpredictable place. No matter how well you know a company, there will always be something that takes you by surprise. Deep diligence can lead to unjustified conviction or lull you into a false sense of security. Reluctant to admit to wasted effort, you may dismiss counterarguments and rationalize negative developments. And the time spent taking your knowledge from 99.01 to 99.02 on company A might have been better spent going from 0 to 10 on companies B and C…so even if you have the mental flexibility to change your mind and exit an insanely well researched position, you may find yourself lacking replacement candidates as you literally don’t know what you’re missing. The balance between exploration and exploitation is unique to each person. As for me, I want to be in maybe the 80th to 90th percentile of knowledge on each of the companies I own. But finding myself in the 99th percentile may be a sign that I’m not optimally allocating my scare time.
As an ant returns to its nest after finding a food source, it will leave a pheromone trail for other ants to follow. Those ants, upon finding food at the end of the trail, will leave more pheromones on their way back, further reinforcing the path for other ants. As a food path becomes less promising, fewer ants follow it and the pheromone scent dissipates. So ants explore many possible routes simultaneously and devote ever more resources to the promising ones (what Douglas Hofstadter calls a “parallel terraced scan”…you can read more about this in Melanie Mitchell’s book Complexity). That seems like a good basic model for thinking about how to spend your limited resources. You don’t know what’s worth spending time on at the start, so you extend tentacles every which way. As you gather more knowledge about each, you prune some branches and intensify pursuit of others, and then extend this approach down to avenues of inquiry within each company.
I felt that there are full of interesting angles approaching the companies in the Scuttleblurb posts – and I also felt people love your style of writing factual walkthroughs on the history of the companies without telling them BUY/SELL/HOLD. So basically I thought that you are opening them the door for new possible interpretation of the world but leave the door open for the audiences to close. That is quite different from other analyst or researchers, I guess. What do you like most about your style of work? and what makes you keep it that way?
In investing, writing is very often a tool of persuasion. An analyst does their research, determines the stock is a BUY, and crafts a narrative consistent with that rating, which often leads them to diminish contrary views. I write to understand, not to persuade. Scuttleblurb is a research journal. It’s a place for me to think out loud and figure things out. My thoughts should be structured coherently but they need not coalesce into an airtight consistent thesis that argues why you should buy or sell a particular stock.
This approach doesn’t sell nearly as well as sensationalized long or short reports, especially on certain battleground stocks (Burford[37] in 2019 comes to mind). It may seem that reading two lopsided but opposing takes might get you to something resembling the full picture. But that’s sort of like saying the average of Fox News and MSNBC converges to the truth. Are you really hearing “both sides of an argument” (as if there can only be 2 sides) or just two distorted and motivated points of view? I would much rather get one intellectually honest assessment of things than dogmatic takes on opposite sides of an issue.
At the other interview, you mentioned that writing is part of your process of investing – How writing is adding value to the right investment decision? And what initiates your writing? do you write companies that you want to buy at first? and how do you select the topics of your writing?
I don’t know if I want to buy a company before I write about it but nor do I dive into things totally blind. On the surface, there are glimmers of scale, network effects and other sources of competitive advantage, and I write to flesh out whether and to what degree they apply. These companies come to my attention somewhat serendipitously – in the process of researching one name, I’ll think of another that shares similar characteristics or I’ll stumble upon another company in the same ecosystem that seems interesting.
For instance, Moody’s and S&P are a standards-based duopoly. Their ratings serve as benchmarks that market participants use to peg the credit worthiness of one bond versus another over time. To issue bonds at the lowest possible coupon or have those bonds included in major indices, an issuer must pay Moody’s and S&P for a rating, and each issuer that does so further entrenches Moody’s and S&P as the standard. Researching those companies led me to FICO, which enjoys a similar moat in consumer credit, with its FICO Score ubiquitously adopted by US lenders to assess the creditworthiness of borrowers. And looking into FICO led me to the big 3 national credit bureaus – Equifax, Experian, and TransUnion – who supply the data that goes into FICO’s algorithm and whose data and software are woven into the workflows and business systems of banks. Those business systems include purchase core/issuer processors from Fiserv and Fidelity, who tie into a complex Payments ecosystem that includes card duopolists Visa and Mastercard, merchant acquirers like First Data and Adyen, payment facilitators like Stripe, etc. etc.
For me, I think writing should affect people’s investment decision as they read again what they wrote before, so over time, I believe that writing would help a great deal to make quality feedback on their own decisions. So I am more curious about your experience – Do you have stocks that you initially dig into but ended up not wanting to buy after a while of study?
I don’t buy the vast majority of stocks I write about. That’s the way it should be. For me, writing is a learning expedition. It would be one hell of a coincidence if each one led to “buy” decision. If that were the case, it’d be a sign that I either have insanely good intuition or I am lying to myself (far more likely the latter).
Your research must take quite an amount of time as it doesn’t fail to take deep dive into the wide range of coverage everytime – but for me (based on my own experience), I often felt strong impulse of writing as soon as I come up with an idea (plus we have audiences who waits for me to write), so I could not really focus on the longer-term research. How do you balance research timing and writing?
I do both at the same time. If I just sit back and passively consume content, nothing will stick. So rather than write only after I’ve spent several weeks researching, I will summarize what I’m learning in my own words and come up with questions and theories in real time, organizing paragraphs and sentences along the way. As I do more research, I’ll go back and revise the stuff that is wrong or incomplete.
I believe that the definition of corporate value itself or the way to gauge corporate value have not been changed by the technological advances, but sometimes I throw doubts on that beliefs, too – especially when I am looking at the balance sheets of the companies of big techs, I often ask questions myself such as ‘where’s the IPs of Apple?’ ‘where’s the most valuable assets of Google – their tech engineers!’ ‘where’s the culture of Amazon?’ ‘where’s Elon Musk’s COVID19 health condition in Tesla’s balance sheet?’ How value investors have to adopt the new changes? and how are you evolving?
Even for industries that are heavy in tangible assets, value creation is often tied to intangibles. Value resides less so in things but in how creatively and efficiently those things are arranged and used.
Take the low-cost European airline Ryanair for example. The key to operating a consistently profitable airline is to command the lowest unit costs, which is a function of cost discipline and having full planes in the air for as long as possible. Ryanair enforced single-class seating to speed onboarding; did away with in-flight meals to minimize clean-up time; and standardized on a single aircraft model to reduce crew training and maintenance costs. They targeted uncongested secondary airports, where planes could take-off and land faster and which were willing to agree to lower landing fees. Cost savings from the above actions were invested in lower ticket prices, which attracted more passengers, giving Ryanair the leverage to bargain for lower landing fees at airports and secure aircraft volume discounts from Boeing, which cost savings were partly recycled into still lower fares. Leading up to the COVID-19 pandemic, Ryanair was profitable every year since at least 2000, averaging close to 20% operating margins. That’s unheard of for an airline. Clearly, Ryanair is more than just the value of the planes on its balance sheet. Anyone with a few billion dollars can own jets; what’s hard is replicating all the activities that give rise to the feedback effects of scale. A number of incumbent airlines have tried and failed.
Or consider Amazon’s e-commerce business, which has around $105 billion of PP&E assigned to it. The link between those considerable tangible assets and business value is the intangibles that surround it: an organizational setup comprised of small agile teams who can innovate and launch new products without much incremental bureaucracy; the famous flywheel dynamic, where order volumes leverage fixed costs and attract suppliers, resulting in more product selection and lower unit costs that are passed on to consumers, both of which draws more order volumes; a subscription program, Prime, that promotes customer loyalty and accelerates flywheel spin. Riding on top of all that is $40 billion of revenue from digital ads. While it didn’t generate any meaningful revenue until maybe 5 years ago, the digital ads business was really almost 30 years in the making: without Amazon’s logistics base and the aggregation of consumer demand, the ads business doesn’t exist.
Fixed assets are a double-edged sword. The resulting operating leverage can wreck a company. But when paired with intangibles – culture, org structure, software, online distribution, and other stuff you won’t see on a balance sheet – that optimize their use, they can create an insurmountable moat.
Now, a unique property of companies that directly monetize intangibles is the degree to which they can scale. It doesn’t matter how much scale and cost discipline Ryanair has, there are only so many people that can ride its planes in a given year. The same constraints don’t apply to an online business like Google. Before Google, search engines determined relevance by matching site content with user queries, an approach that taxed computing resources by more than it improved search quality as more and more pages were indexed. Google’s algorithm, on the other hand, works like a voting system, where pages are ranked based on the quality and volume of inbound links from other sites. It gets stronger as the web grows. And as more users choose Google for its superior search results, the more data Google has to deliver even better results, attracting still more users.
Google enjoys winner-take-most outcomes. There are feedback effects to scale and, because its service is equally accessible to everyone, there is no reason for users to opt for the second-best search engine. There are practically no marginal costs or constraints to delivering search results (and the corresponding ads) to almost anyone in the world, so Google can grow its revenue to an extent that an airline or car manufacturer cannot. Last year, Google did over $209 billion of ad revenue, up from $135 billion in 2019. That kind of growth on such a huge base is without precedent in the pre-internet age and we should think twice about applying base rates from that era to digital businesses today (I touched on this in my interview with LibertyRPF[38] earlier this year).
If you feel comfortable, can you tell us your relationship with Korea? (I just assume that you have something in Korea as your last name is KIM)
I was born and raised in the states, but my mom is from Busan and my dad is from Daegu. I have lots of family in Seoul and try to make it back there every few years.
[CMPR – Cimpress NV] Scale Economies and Hard Realities, Pt. 3
Posted By
scuttleblurb
On
In
SAMPLE POSTS,[CMPR] Cimpress NV |
Comments Disabled
Cimpress is a fine business that has been in search of strategic direction for the last 6-7 years, groping for the right balance between value-added customization and low-cost production. These two sources of differentiation are often at odds because the scale economies required to claim a cost advantage depend on running lots and lots of volume across significant fixed costs, a process that is best suited for homogeneous products that share a common manufacturing base and process. You can imagine casting a single widget SKU over and over again. There are no incremental set-up costs from line changeovers. The assembly line just keeps humming as long as it can, spewing a stream of identical widgets onto a continuously flowing conveyor belt, the upfront cost of heavy equipment diffused over more and more manufactured units. At the other extreme, a stylist’s average cost per haircut stays roughly the same, whether he does 20 haircuts a day or 30.
Of course, most jobs fall somewhere between these two poles. Cimpress (originally known as VistaPrint), which makes a variety of customized physical marketing materials – business cards, signage, apparel, gifts – for mostly micro business with fewer than 10 employees, claims that it can capture the benefits of both differentiation and low-cost (“mass customization”):
Source: Cimpress Business cards are a perfect use case for mass customization because from the customer’s perspective, a set of business cards, tatooed with a unique logo and font, is unique; but from Vistapint’s perspective, the core manufacturing process and materials required to produce them is essentially the same across all customers. And after its founding in 1995, Cimpress spent the first dozen or so years of its existence focused on paper-based products…business cards (where it remains dominant) postcards, brochures, presentation folders, data sheets, and the like, predominantly in North America. Volume brought scale, scale compressed average unit costs, profits from cost advantages funded VistaPrint’s strategy, which was to litter inboxes with cheesy marketing campaigns offering something like business cards or return address labels for free and drawing customers to the website, where they could then be cross-sold other products and bamboozled with exorbitant shipping costs on the check out page (after they’d already spent the time designing their items and were psychologically committed to the purchase).
Today, Vistaprint prints 6bn business cards a year, one for nearly every person on the planet. It can produce a pack of business cards in less than 10 seconds and fulfill the order in less than 2 minutes. No one else comes anywhere close to extracting the scale economies enabled by that kind of volume. Although paper-based marketing, including business cards, is in decline, the company’s Vistaprint segment is still showing high-single/low double digit organic growth as it continues to steal share from the tens of thousands of small manual operations that still account for most of the putative $30bn market opportunity [per management; computed as 60mn small businesses with fewer than 10 employees across North America, Europe, Australia, and New Zealand multiplied by $500 in annual marketing spend], leaving Cimpress, with just $2.4bn of total revenue, plenty of runway ahead.
But sometime in 2011, with revenue growth decelerating, management embarked on an aggressive M&A strategy. Since fy11 (fiscal year ends June), on top of ~$590mn in capex and capitalized software development, management has spent around $900mn buying 15 companies – ranging from a DIY website building (Webs.com) to a host of European print and design companies catering to graphics professionals (consolidated as the “Upload and Print” operating segment) – tangentially related to the core Vistaprint business by dint of their marketing orientation but otherwise diffuse in terms of product SKUs and addressable markets. And for this ~$1.5bn investment, Cimpress’ EBITDA (after stock comp) has grown by just $106mn, a 7% pre-tax return compared to management’s 10% hurdle rate for predictable organic investments in developed countries and 25% bogey for riskier investments in emerging markets. Now, one might argue that the cost structure is larded with growth opex that will eventually subside. But, we’ve also heard this line from management before, as it has fumbled its way from one strategy to the next.
The first course correction came in fy11, when management recognized that deep discounting, aggressive cross-selling, and cheap checkout tricks were compromising repeat purchase rates, diluting lifetime customer values, and attracting low quality customers looking for an easy deal…basically, a leaky bucket that required constant infusions of customer acquisition spend that management did not think was sustainable. And so, Cimpress made significant investments in packaging, product quality, and user experience on the site. It dramatically reduced what it charged customers for shipping, which at the time apparently made up a “very material portion of revenues”, and introduced less jarring discounts on more transparent list prices. These actions were meant to chase away the cheapskates who only cared about price, leaving the company with a more loyal and satisfied core more apt to repeat purchase. Didn’t really work. Despite some operational improvements – quality complaints, production throughput times, late deliveries all improved – organic revenue growth slowed from 22% in fy11 to 20%, then 12%, then 4% over the subsequent 3 years. Gross margins declined a bit, EBITDA margins declined a lot. Buyer repeat rates actually declined from 30% to 26%. Management’s initial expectations for $5 EPS (representing 20% annual growth over 5 years) and $2bn in revenue by fy16, would clearly not come to pass. That brings us to Act II.
Sometime in fy13, the company embarked on an effort to disaggregate its tech platform into a set of software microservices appropriately named the Mass Customization Platform (MCP) as part of a broader effort to centralize all sorts kinds of functions – product management, order routing, fulfillment, commodities procurement – across its 20+ brands:
“…our vision for MCP is to be a constellation of modular, reusable and independently functioning software components and related services which is analogous to a well-organized set of interchangeable Lego blocks. This platform will sort millions of heterogeneous incoming orders into homogeneous specialized production streams which, thanks to the automated workflow and the regular repetitive production steps we can enable, will embody the principles of mass customization. Yet, the overall platform needs to remain reconfigurable and modular to ensure the relevance to a wide variety of applications….what we are doing is we are frankly trying to break the businesses which we bought, not just Vistaprint, but each of the individual companies we bought, into the component parts of the merchant, the customer-facing business unit with the brand and the fulfiller, and then to reconfigure all the IT systems so that those can…act as a routing layer between those.” – Robert Keane, Chairman and CEO (Cimpress Investor Day, 8/10/2016)
Management’s big idea was to create a matchmaking service that would pair the unique, specialized, and often small-sized manufacturing and fulfillment needs of its sprawling internal businesses (“merchants”) – some selling business cards to micro-businesses in the US, others serving graphic design pros in Europe who in turn serve micro-businesses – to its most cost effective option among a network of in-house and third party production plants and shipping/logistics providers. As the number of fulfillment partners joining the platform expanded, so too would the number of SKUs the company could offer, which in turn would attract still more fulfillment partners seeking production volumes to run through their specialized plants. Two-sided engagement would lift volumes flowing through Cimpress’ network, bringing procurement leverage to bear against service providers, equipment vendors, and commodities suppliers.
But just 5 months after promulgating this lofty vision during 2016 Investor Day, management conceded that this centralized model, which was intended to increase speed to market and production flexibility, had instead bogged down the company with complexity and bureaucracy. It announced plans to retreat back to a more decentralized organizational setup wherein production, fulfillment, and product management would be siloed once again by brand, though non-core corporate functions (finance, legal, major capital allocation), procurement, and the modularized technology platform would remain as shared services across banners. Now the thinking is that decentralization will unleash “entrepreneurial energy”, ensure accountability for results, and improve customer satisfaction. And that’s where we are today. Mistakes have been made, that much is clear. The company’s acquisition of DIY website builder Webs.com, one of it’s largest, seems particularly ill-conceived. Website building is a high gross margin business that pure-plays struggle to monetize because lofty customer acquisition costs eat up all the profits. But Cimpress believed it could do away with much of these advertising costs by cross-selling web services into its existing customer base, because in management’s own words “…a website is the same as a brochure, but it’s a digital version of that.”
But of course, a website is more than just another marketing tool that you toss into the shopping cart as you purchase signs and business cards; it’s increasingly the entire digital storefront and a critical system of record. The companies that do well in website building either own critical on-ramps like domain registration (Godaddy) or offer kick-ass functionality further up the stack, with sophisticated, friction alleviating technology and/or 3rd-party app integrations (Wix and Shopify). And there’s a reason why website builders don’t bundle business cards…not only are these offerings not a natural point of integration, but doing well in either area involves entirely different processes. I’m not rehashing Cimpress’ somewhat ignomonious capital allocation and strategy choices with snark (or I at least hope it doesn’t come across that way). On the contrary, I think it’s admirable that this management team at least attempts to take an earnest look at its shortcomings, fesses up to them, and experiments with new ideas. I bring this up just to frame the difficulty of growing through a continuous product introductions and simultaneously extracting scale economies.
At one extreme, the company could have just stuck to business cards and closely related paper-based products, gaining a little more production leverage every year and steadily improving its gross margins…but growth would have inevitably slowed and then reversed as the market for business cards is in decline and Cimpress’ business card revenue growth has decelerated significantly over the last decade. But then, proliferating product categories to boost volume growth makes scale economies harder to come by. Through the acquisitions that now comprise its Upload and Print segment, Cimpress multiplied its SKU count by 300x, and the number continues to grow at a rapid pace. The scale benefits attending homogeneous manufacturing and fulfillment processes attenuate as you start offering different substrates and formats, and especially as you expand into banners, apparel, pens, magnets, and other trinkets made of entirely different materials, manufactured through a different process with different equipment in different countries. I think the company recognized this long ago, hence its emphasis on higher quality products to customers with better lifetime values; but I also think it’s fair to say that management underestimated how difficult it would be to reap the benefits of mass production over so many diverse product categories. Check out their margins over time…
The nosedive in gross margins can be mostly explained by investment in design services and a mix shift towards Upload and Print, which has been growing faster than Vistaprint and is more dependent on outsourced production. But, this segment also has lower sales and marketing costs per order than Vistaprint and all else equal, the two segments should have comparable EBITDA margins…but those have declined considerably as well over the last decade, even as Cimpress has shown some sales & marketing and G&A leverage over time. I think this can be at least partly explained by shipping, which runs through gross profit. The company is loath and perhaps embarrassed(?) to reveal how much money it was making on shipping, but assuming average shipping price charged to the customer of $10 and an average order value (back when management still revealed this figure) of around $35, it was clearly significant.
I don’t imagine its own shipping costs have changed by nearly as much, and so providing relief to its own customers likely translates to a mostly direct gross profit hit. Also, losses from the “all other business units” segment, which houses speculative investments, emerging markets, partnerships, continue to grow, from -$9mn in fy16 to -$36mn LTM. Finally, digital products and services (Webs.com I assume?) has witnessed significant revenue declines. Except for maybe losses in emerging markets, which are still small and sub-scale, none of the above mentioned causes of margin compression will reverse, so the high-teens EBITDA margins of the mid/late 2000s are likely a thing of the past. Management does not deny this and, in the face of persistently declining margins, now directs investors to think instead about dollar profits, retention rates, and lifetime customer values, tacitly acknowledging that ever more of the scale benefits are shifting from production leverage to value-add per customer. Cimpress’ last 10-K (year ending June 2017) reveals 17mn customers served by Vistaprint, which means the number of unique customers hasn’t budged since fy14. However, Vistaprint’s revenue has grown by over 25% over that time, implying that revenue per customer has gone from $65 to around $80. Management does not break out gross profit or opex by business segment in its financials, but we do have this useful exhibit from the last Investor Day:
The buyer repeat rate, at between 30%-35%, is so low that one wonders whether the lifetime value of customers is really the right metric for management to focus on, but let’s just go with it. So if revenue per Vistaprint customer is $80, then it looks like gross profit per sub is close to $50. Assuming a 10% discount rate and that 35% of buyers make repeat purchases [I’m assuming it’s higher than the 31% rate the company disclosed for fy17] implies an LTV per customer of $73. Before the company went on its acquisition spree and it was just basically Vistaprint, the cost of customer acquisition was around $24, suggesting an LTV:CAC of ~3x. Once you factor in higher recurring costs of supporting today’s relatively higher quality customers, the ratio is probably closer to 2.5x(?), right at the cusp of acceptability. To put that in perspective, Trupanion is at ~4.5x, Godaddy is over 5x. [Founder and CEO Robert Keane writes the kind of letters that value investors just eat up, chock full as they are of Buffett-esque straight talk and verbiage. But I’ve actually found disclosure to be frustratingly inconsistent. For instance, up until fy14, the company provided metrics on average order values (AOV), order volumes, repeat customers, bookings per repeat customer, and other good stuff. They stopped regularly disclosing most of this in fy15, defending the move by maintaining that a metric like $AOV doesn’t provide much insight because there are so many businesses besides Vistaprint. Like, huh? Vistaprint still represents 65% of revenue, 80% of segment profits, and the majority of organic investments. And even if that weren’t the case, why stop disclosing the very data required to estimate lifetime value at precisely the time in the company’s history when it is explicitly targeting this metric?]
As mentioned earlier, Cimpress’ acquisitions and organic investments over the last 5-6 years appear to have impaired value, with returns on incremental capital falling short of capital costs, and over time, we see that the company’s returns have deteriorated rather markedly in even the last few years. And they are way below the the 30%+ returns the company was realizing before its spree. Meanwhile, over the last 5 years, organic growth has been cut nearly in half, from 20% in fy12 to ~10%/11% LTM.
[“adjusted” because the numerator excludes restructuring charges; acquisition related earn-outs, amortization, and depreciation; and impairments]
But that hasn’t stopped valuation multiples from doubling over that period.
But perhaps I am throwing excessive shade. While I think Cimpress is a worse company than it was 5-10 years ago and its mass customization platform is maybe not quite what was promised, it’s still hard to imagine a competitor rivaling Cimpress’ scale advantages, and I think the company will continue taking enough share to deliver high-single/low double-digit organic revenue growth for the foreseeable future. Founder and CEO Robert Keane, who owns 10.5% of the company and owns the same number of shares as he did 7 years ago, has significant skin in the game. The company has retired nearly 30% of its shares over the last 7.5 years in the low-$40s. Using the high-end of management’s estimate of investments required to grow free cash flow by at least inflation, LTM mFCFE per share is around $8/share [1], so the stock trades at ~20x, which doesn’t seem too demanding a valuation given the company’s competitive positioning and growth opportunities. Cimpress recently reported an outstanding quarter across all reported segments, suggesting budding traction with its decentralization initiative. But I frankly have no idea if this inflection is sustainable.
Given the pronounced deceleration in core legacy business cards, where the engine of mass customization was applied beautifully for the first 15 years of the company’s life, diversifying into far flung SKUs may have seemed sensible at the time….they were squeezing less juice from scale economies but could compensate for that by moving upmarket, offering a value-added bundle proposition with a heavier service component. But in retrospect, shareholders would probably have been better off if management just maximized the hell out of lower organic growth and plowed excess capital – capital that could not be reinvested into core Vistaprint – into share buybacks rather than acquisitions. [1] Estimating relief under the new US tax law is tricky because the company already reallocates income across a sprawl of geographies to minimize its tax payments. Cimpress derives just 40% of its revenue from the US and over the past year paid just $40mn in cash taxes on $180mn in pre-tax cash profit, so I’m not so sure the new rule will meaningfully benefit the company.