Posted By
scuttleblurb
On
In
SAMPLE POSTS,[ADYEN] Adyen N.V. |
2 Comments
Before exploring the competitive concerns that have sent shares cratering nearly 60%, it’s worth reflecting on what it is that got people excited about Adyen in the first place.
In a typical online transaction, a shopper’s credit card details are picked up and encrypted by a gateway, then routed to the appropriate merchant acquirer. The merchant acquirer, through a payment processor, sends that information to Visa or Mastercard, who routes that information to the card issuing bank, who authorizes the merchant acquirer to accept payment. Merchant acquirers and payment processors are often seen as one in the same but they technically play different roles. Merchant acquirers are financial institutions. As members of card networks, they bear responsibility for chargebacks and disputes, ensure that the merchants they onboard comply with regulatory requirements and, assuming the transaction is approved, receive money from card issuing banks. Payment processors are software. They intermediate transaction details between the gateway and the acquiring bank.
The confusion between acquirers and processors is understandable as incumbent processors like First Data and Vantiv were once owned by banks before being cleaved off as separate entities, creating a daisy chain of interactions where most steps in the payments flow were handled by different entities. A gateway like CyberSource or Braintree was distinct from a merchant acquiring bank like Wells Fargo, Bank of America, or Citigroup, which in turn was separate from a merchant acquirer processor like First Data or Worldpay. The fragmented, arms-length arrangements forced merchants to maintain a host of connections. A large multinational retailer might have relationships with dozens of different merchant acquirers and gateways across the globe.
In the 2010s, payment service providers (PSPs) like Stripe emerged to simplify this process by sitting between the merchant and acquiring banks. Instead of opening accounts directly with acquiring banks, a process that could take weeks, a merchant could instead open an account with Stripe, who would rent the Bank Identification Number (BIN)1[1] of acquiring banks (”rent-a-BIN”). This arrangement gave Stripe the right to onboard merchants according to the acquiring banks’ underwriting rules, provide ongoing account services to the merchant, authorize transactions, and collect transaction data. Stripe pays a fee to the acquiring bank, who still assume risk of loss but otherwise retains most of the merchant acquirer economics.
So, to a writer with a paywalled blog on Substack it might appear that Stripe is talking directly to card networks and sending funds from the subscriber’s bank to yours. But under the hood what’s happening is Stripe is sending encrypted card details to an acquiring bank like Wells Fargo or PNC, who in turn is using First Data or some other processor to interface with card rails. Some payment providers will say they offer “merchant acquiring services” or even refer to themselves as a merchant acquirer. But usually what they mean is they are licensing a BIN from third party financial institutions. It is crucial that PSPs process volumes locally, either by owning a bank license or renting one, in each country that they accept payments, as domestic transactions are settled faster, avoid FX fees that attach to cross-country processing, and more likely to be approved by local card issuing banks, who see purchases within their borders as less risky.
The card networks we’re most familiar with in the US are but a fraction of payment methods available globally. Bank transfers are used in 1/3 of online transactions in Germany and in just over half of online transactions in the Netherlands. In India and Thailand, bank transfers and wallets account for around 60% of e-commerce purchases. Moreover, a wide variety of card schemes, bank transfer apps, wallets, and other payment methods are used in different regions and countries, including MercadoPago in South and Central America, Samsung Pay in Asia Pac, Boleto and PIX in Brazil, iDEAL in the Netherlands, Alipay in Asia, PayPal in Germany and the US, etc. Often times, PSPs will rely on aggregators to access the most widely accepted payment methods in every country. For instance, Stripe, PayPal, and Global Payments integrate with an aggregator called PPRO[2], who in turn maintains connections with more than 400 non-card payment methods across the globe.
Adyen started as a gateway but took things several steps further. Instead of renting BINs or integrating with an aggregator, they own banking licenses outright wherever they can2[3] and directly integrate with local payment methods. Combining the gateway with merchant acquiring and processing means Adyen can underwrite merchants according to their own compliance standards and save on fees they would otherwise pay a third party acquirer. But more importantly, it gives them greater visibility into and control over the payments flow. As an acquiring bank with direct access to card rails, Adyen can iteratively tweak messaging details in an authorization request to improve the chances that the issuer bank will accept it. If a payment fails due to a connection issue at the level of the acquiring bank or processor, they can more easily see and rapidly fix it than most other payment service providers, who obviously can’t inspect the systems of the acquiring banks they rent BINS from. Adyen, more so than any other PSP, is very opinionated about owning the full stack. They would rather not process payments in a country at all than gateway to third party acquirers, whose variable performance dilutes their exacting service standards.
Control not only applies to the payments flow but extends to the enabling technology. Adyen runs a single platform that it built from the ground up. A merchant need integrate just once to access processing capabilities anywhere in the world, both online and at physical point-of-sale. All merchants share the same platform. Upgrades and new products are rolled out across the globe at once. By contrast, legacy PSPs like Worldpay stitched together a patchwork of providers through a flurry of acquisitions. After struggling to build unified platforms, most legacy providers gave up and came to accept the disparate hodgepodge. First Data’s integration saga went on for about a decade before they threw finally in the towel. Now they’re stuck in this sclerotic state where updates to one platform aren’t automatically carried over to the others; new products, like risk management or FX tools, need to be built multiple times to accommodate different codebases; and transaction data that could inform risk scores and improve authorization rates circulate in siloes.
Incumbents responded to the mounting threat posed modern PSPs, not by streamlining their platforms to better compete, but by doubling down on megamergers. But buying scale never resolved the root problems that caused them to lose so much share in the first place. In a damning indictment of this acquisition-fueled strategy, FIS recently agreed to sell a 55% interest in Worldpay[4], valuing the latter at $18.5bn, a whopping 55% discount to the $43bn it paid just 4 years earlier.
But even compared to Stripe, arguably the most celebrated modern PSP of all, Adyen stands out. In 2022, Adyen reported 55% EBITDA margins on about $278mn of payment volume $483k of net revenue per employee (on today’s frontloaded employee base, which has grown by just over 50% from a year ago, Adyen is doing just $405k of net revenue per employee). By contrast, Stripe lost money on just $102mn of volume and $350k of net revenue per employee (they are supposedly on pace to hit $100mn of EBITDA this year…but including stock comp?)3[5]. Some will object that the difference in profitability is due to compensation in the US being substantially higher than it is in Europe. That explains some, but not all of it. Even if Stripe’s expenses/employee were the same as Adyen’s last year, its EBITDA margins would have still been about 20 points lower.
For years the payments landscape was bifurcated between incumbents with meager growth who managed for margins and modern fintechs who reported losses but stole volume. Adyen avoided this trade-off. While legacy players acquired growth, adding to the jumble of platforms that made it so hard for them to innovate, Adyen grew organically, scaling one global platform. While modern fintechs splurged on pricey engineering talent, Adyen accelerated its hiring only in the last 3 quarters, when it was able to pick up for cheap talent that its peers were eagerly laying off. While PayPal groped its way toward a super-app and Stripe bet on sprawling initiatives to advance the grandiose vision of expanding “the GDP of the internet”, Adyen concentrated its engineering resources only on products its merchants wanted. In a sea of sloppy execution and distraction, the company exhibited a profound degree of focus, discipline, and frugality.
These unique cultural attributes powered eye-popping growth and industry-leading margins. Management announced last year it would be accelerating headcount to support growth, particularly in North America, an investment that would temporarily depress margins. But this was well understood and even celebrated (”look how long-term they are” “they zig when others zag” “capacity to suffer!”…that kind of thing). Then last quarter, Adyen cited “increasing competitive pressure in North America” as the culprit behind a dramatic deceleration in the region (net revenue growth in North America went from growing 36% in 2h22 to just 13% in 1h23) and everyone freaked out. It is one thing to invest ahead of growth. It is quite another to invest behind a structurally impaired market.
It soon became clear that price cutting at Braintree was most salient cause of the intensifying competitive environment.
Setting aside the execution and strategic issues that have plagued it, PayPal, who I once described as a “gangly fintech behemoth running on legacy tech whose long tail of fintech assets are united by vague super app ambitions but otherwise lack concrete product and ux cohesion”, is still a ubiquitous and trusted brand among consumers, who are supposedly more likely to convert into shoppers and spend more if the PayPal button is featured at checkout. In 2013 they acquired Braintree, an “unbranded” gateway that merchants could white label to accept payments across different merchant acquirers. A sideshow inside the PayPal complex, Braintree more or less operated as a separate entity for years. It was never prioritized for investment and lagged behind Adyen and Stripe, who have in the intervening years released a slew of additional products atop their payments baseload (from 2015 to LTM, Adyen’s processing volumes have grown from €32bn to €848bn while Braintree’s have grown from $50bn to an estimated ~$450bn). But after 8 years of trying, management claims that PayPal and Braintree now run on the same modern tech stack.
The technical integration is reflected in their commercial strategy too. Branded PayPal realizes much higher margins than Braintree, even controlling for differences in merchant mix, mostly because the former doesn’t pay interchange fees, the biggest “cost of goods” for a payments facilitator, on the 20% of PayPal transactions that bypass card rails. Moreover, according to Lisa Ellis from MoffettNathanson in her interview with Stratechery[6], a disproportionate amount of the other 80% flows through debit, whose interchange fees are much lower than credit. But the PayPal brand was also musty and saturated and facing competition from a host of alternative e-wallets. So to stoke branded adoption, PayPal began loss-leading with Braintree, giving the latter away at ~cost to merchants who also featured the PayPal checkout button. This maneuver has had a predictable effect on Braintree volumes, which swelled ~30% YTD to ~$450bn after growing 42% in 2022 (by comparison, in 2022 Adyen’s volumes grew 49% last year to $829bn while Stripe’s volumes grew 26% to $817bn).
Loss-leading with Braintree to boost branded PayPal adoption poses a conflict since PayPal is incentivized to push its own wallet while Braintree is compelled to integrate with all the most widely used payment methods. Braintree can choose to be agnostic about payment methods, but pricing at cost means that volumes processed through credit cards, Apple Pay, or any other medium except PayPal, are destructive to unit economics. Alternatively, Braintree can prioritize PayPal at checkout but doing so renders them less competitive with PSPs who feature a wider range of options.
Whether cross-subsidization proves viable ultimately boils down to how much shoppers prefer PayPal over other competing payment options. The incremental gains from using rock-bottom take rates at Braintree – take rates that don’t make sense absent a lift in branded PayPal volumes – to get the PayPal button prominently tattooed on more checkout pages could be more than offset by the incremental losses generated from transaction volumes shifting to Apple Pay or Shop Pay as online commerce continues to migrate to smartphones. It doesn’t matter if the PayPal button is featured in more places than it already is if people use it less. Even if branded volumes grow in aggregate, a big enough mix shift toward competing payment options intermediated through Braintree across the entire merchant base would still adversely impact profitability. So really what this strategy amounts to is doubling down on the PayPal wallet and, along with that, a bet on the associated investments and initiatives that the company has for years pursued to maintain branded PayPal’s relevance in eyes of consumers. Same as it ever was.
Will shareholders stick around for more of that? They’ve seen the stock crater by nearly 80% from its peak just more than 2 years ago. Transaction profits have declined from 1.3% to 0.89% of volumes since 2020 as margin dilutive unbranded volumes, fueled by aggressive pricing, have outpaced branded. Meanwhile, the company’s outsized stock based comp and flat margins seem out of sync with renewed concerns over profitability.
Braintree is rumored to have started cutting price ~1.5-2 years ago, which coincides with the marked deterioration in transaction margins and acceleration of Braintree volumes. That enterprises have become particularly cost-conscious and receptive to easy wins in the last few quarters could be why Adyen didn’t see much of an impact until this year. PayPal insists that unbranded margins will improve as Braintree caters to more smaller merchants (net revenue spreads are higher for low-volume customers), expands internationally (interchange costs are lower in Europe than in the US), and cross-sells ancillary FX and risk management services. In fact, they expect transaction margin dollars, which contracted in 2022 and ytd, to grow again in 4q. But that’s going to hard to pull off if they keep taking Braintree pricing down in the US, which still accounts for the vast majority of their volumes. So it’s possible that as low as Braintree pricing is today, it won’t be driven even lower from here, in which case the migration of processing volumes to Braintree should start to slow.
Still, you don’t necessarily want to bank on that? Even setting aside vigorous price cutting by Braintree, North America is an insanely competitive market and has been for decades. It is unrealistic to think that Adyen can deliver consistently better authorization rates here. Even with local acquiring and a modern tech stack, they are likely at a structural disadvantage to JP Morgan Chase, who issues about 20% of credit cards in the US and a similar share[7] of merchant acquiring. If Adyen claims data advantages by owning the gateway and acquiring bank, how much better off still is JP Morgan, who owns the gateway, acquiring bank, and the card issuing bank, for the significant minority of US transactions intermediated through its cards? I would think that Braintree routing a Chase BIN to Chase produces systematically better auth rates than Ayden processing a Chase BIN internally? And then of course, Chase can and does loss lead with payments processing to win profitable banking and treasury management business.
But parsing performance by geography alone without considering broader strategic context is missing the forest for the trees. Adyen was carried to North America by its multinational merchant base and developing a presence there lent weight to its founding premise of offering local payments anywhere in the world on one platform. They have an opportunity to, in a sense, do some loss-leading of their own, only across geographies instead of payment layers, tweaking pricing in North America in service of a broader relationship that encompasses all the other regions, where payments is less commoditized and more fragmented.
The unique value that a PSP offers varies by use case and region: digital-only payments is a commodity in North America and somewhat less so in heterogeneous region like Europe, where payment types and compliance requirements vary by country. Marketplaces and platforms like eBay, Shopify, and Airbnb have complex global acquiring needs, but they are also tech companies at heart who have the resources and know-how to handle risk and KYC functions in-house, as well as the scale to negotiate favorable rates. Adyen is going after SMBs by plugging into the platforms that increasingly host them, thus converting SMB acquisition into a familiar enterprise sales motion. Its marketplace/platform product, Adyen for Platforms, has seen volumes explode from €3bn in 2019 to €102bn LTM, in large part due to eBay, a customer that Adyen stole from PayPal. Net revenue has got to be razor thin as a fraction of volumes but also very incrementally profitable on Adyen’s largely fixed cost base…plus, payments creates an opening to cross-sell lending, issuing, and other high margin ancillaries to the platform’s merchant base.
Where Adyen stands apart from the pack is in its ability to serve sophisticated global retailers who are not tech companies themselves but are tech-forward enough to embrace omnichannel. It is far easier for large merchants to do BOPIS, online sales with offline returns, and otherwise create 360 customer profiles by consolidating on a single platform that traverses both digital and physical commerce. Volumes from Unified Commerce (omnichannel) have exploded from just €45bn in 2019 (19% of total processed volumes) to €225bn (27%), with the point-of-sale component ballooning from €17bn to €124bn. Over the last year, UC and POS volumes have grown 47% and 54%, respectively, outpacing the 30% growth rates posted by Digital-only, where the competitive pressures from North America have been most acutely felt. Besides the deluge of payment volumes it delivers, omnichannel is a hook for more enduring and expansive engagements. Offline commerce is stickier – it is much harder to swap out physical terminals than it is to direct online volumes to a competing PSP – so a retailer who uses Adyen for point-of-sale and takes omnichannel seriously will also be more inclined to route online volumes to Adyen as well, assuming no systemic deficiencies in authorization rates. As customers consolidate more of their flows, Adyen can monetize other hooks like risk management, card issuing, capital, and payouts.
So if North America is a race to zero, then that raises the question of who is providing the most value elsewhere. Everyone will do FX services, risk alerting, issuing, and the rest. But Adyen seems uniquely placed to claim end-to-end local acquiring across many regions at once, online and offline. To put it another way, Adyen is more an “N of 1” in the thing they are known for than other PSPs are in the things they are known for. They are also more unique and moated relative to other PSPs than PayPal is to other wallets. Braintree is predominantly focused on the US and doesn’t have full control of the merchant-side payments stack. Mollie is geared to SMBs in Europe. Stripe got started with developers and SMBs and has been trying to climb upmarket, but isn’t yet on par with Adyen in addressing global enterprise use cases and lags behind Adyen in omnichannel. Checkout.com[8] is a European rival that also targets large enterprises with a modern tech stack and local acquiring licenses. While often overlooked in payments conversations – I think most investors would be surprised to know that Checkout was valued at $40bn at its Jan. 2022 peak before it crashed with everything else in fintech – they actually seem like a promising contender to Adyen, at least when it comes to digital-only flows. Meanwhile, I can think of more reasons why Apple Pay and Buy with Prime are better positioned to take share from PayPal than vice versa.
In a nutshell, Adyen’s advantage exists at the intersection of several capabilities. All payments are local but the large enterprises and platforms that Adyen serves are global. There are lots of PSPs out there that can do local processing, but they don’t have Adyen’s global scale. There are incumbents with global scale, but they don’t run a unified platform through a single integration. Payment processing in North America may be a commodity, but local acquiring scaled globally is not. If Braintree insists on pricing at cost, then Adyen will have no choice but to get off its horse and take prices down too. But in my opinion they are better placed to sustainably do so than PayPal both because their cost structure is leaner and because local acquiring at global scale through one platform is a far more differentiated prop that earns them the right to take profits elsewhere.
That Braintree price cutting has had such a sudden and material impact on Adyen volumes in North America has also revived concerns that payments provision is being further commoditized by orchestration layers that make it easy to route transactions to different PSPs based on authorization rates and cost. Disintermediation and aggregation have been ongoing themes since the dawn of electronic payments. Card networks like Visa and Mastercard replace sequestered credit lines at each merchant with one facility that works across all of them. E-wallets like PayPal encompass ACH, account balances, or credit cards. PSPs like Stripe or Adyen subsume wallets, credit card, and bank transfers, payment methods that in turn can be intermediated by an aggregator like PPRO in foreign markets. Gateways provide choice across different acquirers, orchestration platforms do the same across different gateways and PSPs.
The pitch from orchestrators is that responsible merchants should avoid locking themselves in to any one PSP or gateway. The subtext, of course, is that in doing so, the merchant should be more dependent on them. I’m skeptical that PSP orchestration is solving a hard enough problem to warrant a seat at an already crowded table. The sophisticated retailers and platforms that Adyen serves, the type of customers that most value orchestration, already process through dozens of PSPs and will have built routing logic in-house. They might engage a primary acquirer to handle like 60% of flows in a certain region while spreading the remainder across several others, dynamically re-directing volumes if authorization rates or processing costs trip certain thresholds, routing flows based on a PSP’s track record of handling various transaction types.
None of this new. Orchestrators have been around for decades. Enterprise merchants have always plugged into multiple PSPs. And yet, with 80% of payment volumes coming from existing customers and less than 1% of volume churning every year, a significant chunk of Adyen’s growth has come from consistently taking wallet share4[9]. Those share gains have coincided with Adyen acquiring banking licenses and offering omnichannel capabilities in new territories, as what might begin as a limited online-only engagement with a retailer in one country eventually expands into an omnichannel relationship across several. Much as Google has retained search share despite competition being just “a click away”, Adyen has consumed a greater share of volumes from merchants who could rather easily re-route to any number of PSPs they connect to, validating the package of competitive auth rates and ease of integration and settlement reporting that Adyen differentiates on.
Given that enterprise customers continue to engage with myriad PSPs, I suspect there is more wallet space for Adyen to carry its advantages into than there are existing volumes for orchestrators and alternative PSPs to route away, particularly since the value of a single integration that handles and formats settlement data in a uniform manner across channels and countries grows as more volumes are concentrated on it. That doesn’t mean a global merchant will sole-source on Adyen (this will never happen). But I can entertain a scenario where an enterprise merchant or platform defaults to the PSP that can solve the hard problem while a jump ball on the commoditized parts, like North American digital-only commerce. In which case, we could see orchestrators starved of oxygen as Adyen, who I’m pretty sure doesn’t plug into third party orchestrators, continues to take wallet share.
I bought some shares of Adyen last month. It’s a small position. That I even own it at all basically reflects my view that Adyen has a uniquely strong value prop for a large slice of global commerce and is run by a thoughtful founder with skin in the game5[10] who will figure out how to convert that position into shareholder value. Payment processing isn’t a franchise like Moody’s. It’s a fast-moving, competitive space that a lean and agile organization like Adyen will maneuver through better than its heavier competitors.
That I haven’t sized it bigger reflects my uncertainty about where profitability ultimately settles and how large the addressable market is for the particular set of capabilities Adyen brings to bear. Management stands behind its long-term 65% EBITDA margin guidance and says it could get there “very, very quickly” if it weren’t investing to support growth. Whether that’s true depends of course on the competitive posture in North America, how Adyen responds to it, and to what degree take rate compression spills over into Europe. Maybe Adyen remains firm on price, PayPal reverses Braintree loss-leading to right its transaction margins, and North American pricing normalizes? Maybe Adyen relents on price and parlays US volume wins into more encompassing global engagements, such that lower transaction margins are offset by volumes to produce similar amount of profits? Moreover, the part of the global payments TAM that Adyen can attack at durably compelling margins is constrained by the fact that its right to earn is grounded in the unique way it serves global merchants with multifaceted flows who think of payments as something more than a commodity. Like, it would be wrong to compare Adyen’s $145bn of point-of-sale volumes against tens of trillions of global offline volumes since only an unknown subset of the latter lands in Adyen’s sweet spot.
All that said, I don’t think you need 65% margins and heroic growth rates for the stock to work from here. Over the next 5 years, if we assume growth is 0 in North America (vs. 33% y/y growth LTM), 15% in EMEA (20%), 20% in Latam (24%), and 25% in APAC (37%), I blend to about 14% on a consolidated basis (compared to 25% LTM and 33% in 2022). This gets us to about $2tn of processed volumes, about where Chase, Worldpay, and First Data are today. Assuming 70% of incremental revenue drops to EBITDA, I land at 58% margins (vs. 63% in 2021). With 80% of EBITDA dropping to net earnings, I can pencil 12%-13% returns at a 25x terminal multiple, including accumulated free cash. Now, even after losing 60% of its value, Adyen still trades at 36x (hopefully depressed) trailing earnings – a huge premium to legacy peers, who trade at low-teens, and in the same ballpark as consensus compounders Visa and Mastercard – so it’s not like the market thinks the company is another payments shitco. I don’t think Adyen is a screaming bargain here. But it’s interesting enough (for me) to get started.
Disclosure: At the time this report was posted, accounts managed by Compound Insight LLC owned shares of Adyen and Moody’s. This may have changed at any time since.
Class 1 freight rails: part 3 – Hunter Harrison, PSR, and investment implications
Posted By
scuttleblurb
On
In
Class 1 rails,SAMPLE POSTS |
No Comments
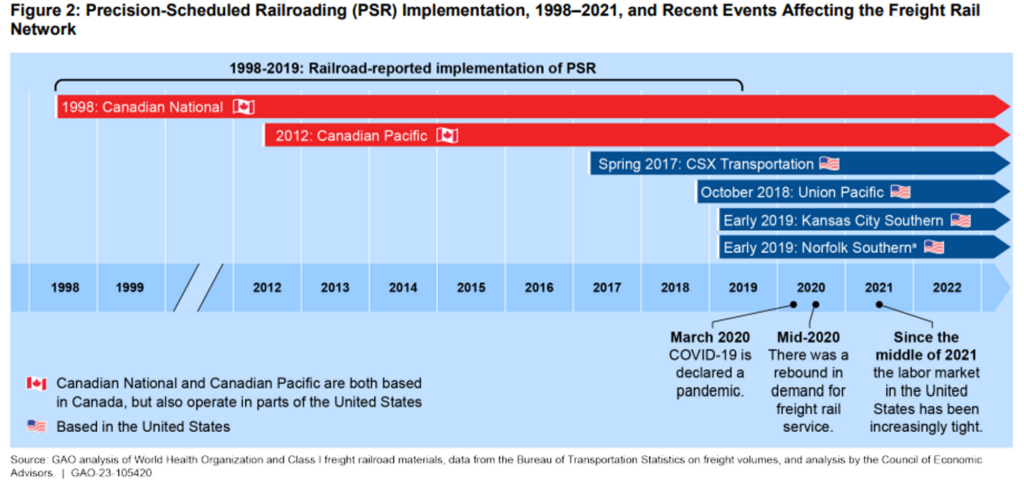
No analysis of the North American railroad industry would be complete without a discussion of Hunter Harrison as no single person has had a bigger impact on the operating performance of Class 1 railroads over the last 25 years. A lifelong railroader who began his career oiling railcars in the early ‘60s when he was just 19 years old, Hunter had turned around 3 railroads (Illinois Central, Canadian National, Canadian Pacific) and was on his way to reviving a fourth (CSX) by the time he passed away in 2017. The principles enabling the dramatic productivity gains at the companies he steered are codified as Precision Scheduled Railroading.
Before PSR took hold across the industry, trains would not depart until fully loaded. They would wait for every shipper’s car to be hitched, such that an outbound train to Kansas City could be idling in Oklahoma City for 14 hours until the arrival of an inbound train from Houston, which in turn would hold up the train from Kansas City to Chicago, etc. Waiting optimized for longer trains but also had the nasty side effect of congesting yards and impeding on-time delivery, much like globules of cholesterol clog the arteries of a circulatory system, preventing blood cells from delivering oxygen to organs. What Hunter Harrison envisioned was a fluid system, one where the right payloads would get to the right place at a scheduled time.
In a network, where nodes are reliant on other nodes for traffic, a constriction here can create delays over there, which can cascade into hold ups over there, etc. Anyone who has flown commercial intuitively understands this. Like airport terminals jammed with stranded passengers, yards of mounting railcar inventory are symptomatic of a sick network. It follows then that a healthy network is one where cars are in constant motion, as approximated by dwell time (the amount of time a railcar spends waiting at a terminal) and, relatedly, car speed (distance divided by time, with time going down as cars spend less time idling at terminals). A train with 200 cars is preferable to one with 80 – same fixed cost of fuel and crew spread across more payload – but those cost savings are for naught if the time spent building longer trains causes delays that create inefficiencies elsewhere. That’s not to say train length doesn’t matter. Just that it is optimized within hard scheduling constraints – fewer pickups with strict take-it-or-leave-it departure times – rather than according to the whims of a customer.
PSR dictates that a railroad optimize car movement across the entire network rather than hit local maxima. In the same way that UPS concerns itself with the on-time door-to-door delivery of packages than with the movement of its trucks, so too do PSR proponents emphasize the predictable delivery of carloads from origin to destination rather than the speed and on-time performance of its trains. It doesn’t matter if a train gets from one yard to the next in record time if the railcars it unloads just sit there awaiting pickup for days.
I certainly don’t understand the intricacies of PSR well enough to get into the fine-grained details of how this is done (and in any case, describing the nuances of a rail network in an essay is kind of like inferring the shape of a complex 3D object from its 2D shadow) but at a high level, scheduled railroading demands simplification, which in practice means: removing hump yards (hundreds of acres of track-laced land where incoming railcars are sorted according to shared outbound destinations), including the associated infrastructure and supervision required to manage its multiple processing steps, and switching trains at smaller flat yards instead; discarding underutilized lines and shuttling longer trains on more direct routes; commingling different freight types to drive incremental volume without additional train starts; and yes, pissing off customers forced to adapt their logistics to the rail rather than the other way around.
Managing network health holistically has all sorts of benefits. Point-to-point hauls lead shorter transit times and more reliable delivery, in the same way flying direct does. Keeping more trains in motion longer means fewer locomotives and railcars for a given volume of freight, which means fewer crew members to drive those trains, fewer mechanics to maintain them, and fewer yards to hold and switch them (with the freed up land either sold or repurposed into warehousing and transloading facilities that bind a railroad closer to their customer). It means the railroad can raise wages for the remaining workforce and still realize margin gains as trains haul freight over longer distances for every hour a unionized employee is paid. It means they can reserve less inventory, parts, and shop space to repair trains and mix toward a newer, lower maintenance fleet as the trains removed from action are the oldest, least fuel efficient ones most in need of care. It means they can stand behind superior service that shippers will pay up for.
These changes don’t comes naturally for a railroad constructed piecemeal through the acquisition of hundreds of smaller lines with parochial interests. Before Hunter Harrison took over, CSX had like 10 divisions that were run as independent companies, each with its own dispatch center and hump yards. Scheduled departures and holistic network-wide considerations were arguably as radical a break from industry tradition as Ryanair enforcing single class seating, operating a single model of aircraft, and targeting less congested airports to hasten take-off times.
Culturally, PSR espouses the philosophy of continuous improvement, a mindset that encourages managers to ask “why” and challenges conventional practices (if a hump yard is the final destination for 10% of cars, why not shut it down and find more efficient routes for the other 90%?), much like the Danaher Business System. The image of Danaher executives on factory floors redesigning machine layouts mirrors that of Hunter Harrison at trainyards listening to radio comms between supervisors and yardmasters or checking into a hotel with a set of binoculars just to evaluate yard operations6[11]. Whether HH studied DBS/kaizen explicitly, he certainly embodied its spirit in his disdain for bureaucracy and the trust he placed with local decisionmakers who were closest to the action and made accountable for results.
Even if Hunter Harrison was the first to clearly see the consequences of PSR, by the early 2000s its basic principles were widely understood, having first been successfully executed at Illinois Central during the early ‘90s. Really what was missing was the will to pull it off. The industry had ossified into cozy regional duopolies run by old timers, insulated within layers of bureaucracy, who prioritized politeness over performance and stasis over speed, who had for so long been steeped in a culture of mediocrity that they had never considered what was possible. And fair enough! Even a go-getter with fresh eyes might observe that rail systems operated as part of a complex ecosystem that had evolved over the course of centuries and assume a Chesterton Fence explanation for why the industry worked the way it did.
Pulling off the radical changes required for step-function improvements required not only “thinking from first principles” but a tone deaf disregard for the way things had always been done. Because the idea of constantly looking for ways to take assets out of the system by operating more efficiently was a direct threat to legions of rail managers accustomed to thinking that problems were solved by throwing resources at them, that their career value corresponded to the scale of assets under their purview, that the customer always came first. Hunter flatly disagreed:
At a conference years later, Harrison recalled Burlington Northern had put stickers up all over its operation that said “The customer is always right.” Harrison joked to a roomful of railroaders that he went around ripping the stickers off the wall. He’d come to the conclusion that if you said yes to everything the customer wanted, you wouldn’t make any money (excerpt from Railroader)
Before PSR proved its value at one major railroad after the next, it had to be imposed by iron will. That even the most basic and obvious improvements – like requiring people to work the full 8 hours they were paid instead of finishing a task in 4 hours and bouncing for the day or having two trains traveling in opposite directions swap crews halfway through their destinations to avoid the lodging and meal costs of overnight stays – were somehow overlooked testifies to just how complacent these organizations had become. Only a renegade insider who eschewed internal politics and dishonored tradition could scythe through layers of bloat and mismanagement.
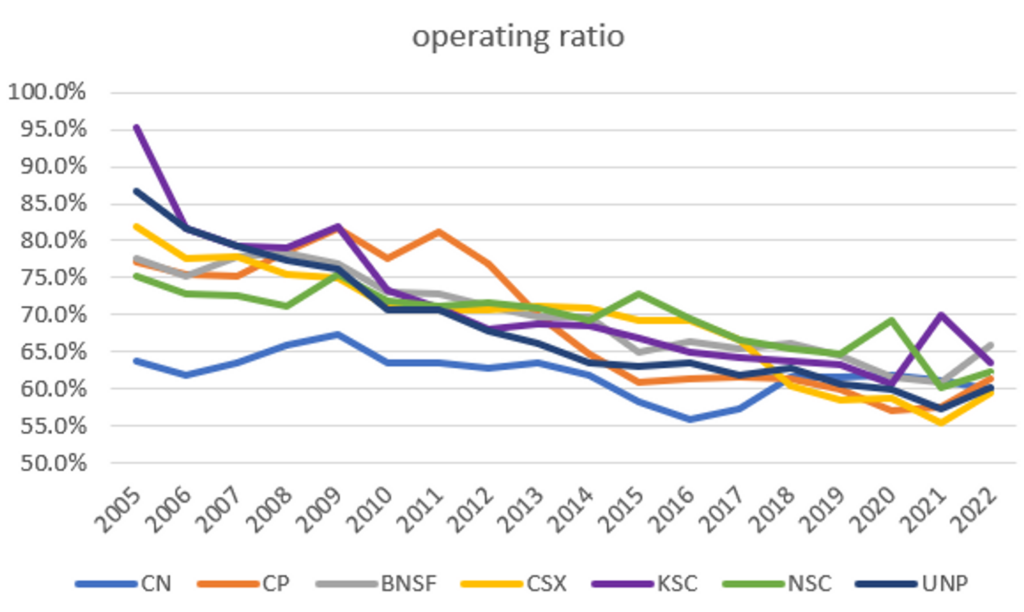
For every time Hunter parachuted into an ailing railroad, he faced resistance from those who could not fathom the idea that they had been doing it wrong this whole time. Skeptics objected that the turnaround at Illinois Central, a regional Class 1 whose Operating Ratio (expenses divided into revenue) collapsed from the high-90s down to 62% under Hunter’s tenure, couldn’t be replicated on a larger scale in harsher climates…until Hunter took the reigns at the transcontinental Canadian National, who had 5x the revenue, and dragged the OR from 79% to 62% over 10 years. At Canadian Pacific, where the OR plummeted from ~80% to 60%, the mountainous Western terrain did not dilute the impact PSR as doubters predicted. Nor did the “spaghetti bowl” network of short lines at CSX, whose OR has improved from ~70% to 60%.
Despite a harsh temperament and a rambunctious, hard-nosed style that clashed with the demure, buttoned down sensibilities of the Canadian railroads he commandeered, Hunter was also known to be an inspirational mentor who had a sharp eye for talent and took considerable time to foster it. At luxurious retreats, Hunter Camps, he schooled promising managers on the merits of PSR and is today survived by loyal disciples who have carried on his work at other companies, including James Foote and Jamie Boychuk at CSX, Jim Vena at Union Pacific, John Orr at Kansas City Southern, and Keith Creel at Canadian Pacific.
But PSR has not been without critics. With labor reductions making up the largest component of OR gains by far, some believe that PSR ultimately boils down to draconian cost cuts that eventually come back to bite its practitioners in the ass. CSX suffered major issues as they began executing the PSR playbook in 2017. NSC, 3 years into PSR, is now facing fierce criticism over the disastrous derailment of a 149-car chemical train that led to the evacuation of a small town this past February. And just look at the degradation in service and operating margins caused by the whipsaw of post-COVID demand patterns and the consequent scramble to replenish crews that had been so enthusiastically cut in years past. Moreover, while PSR may have rewarded shareholders, skeptics will argue that those gains have come at the expense of certain unionized employees, who claim they are subject to more dangerous working conditions, and shippers, who at great cost and inconvenience have had to reconfigure their own logistics to strict time tables or have had their service interrupted as railroads concentrate on the most profitable corridors, in possible violation of common carrier obligations that require them to transport all approved freight at reasonable terms.
First, I think the immediate disruption arising from radical change can be a poor gauge of whether that change ultimately makes sense. If commercial airlines operated the same way freight rails did 20 years ago, maximizing for load factor by holding planes on the tarmac until all ticketed passengers arrived, I’m sure that suddenly switching to strict departure times would have provoked fierce resistance from passengers who liked the way things were before. But if we had to write commercial aviation rules from scratch, who would argue against non-negotiable departure times? Likewise, PSR is bound to provoke complaints, especially early in its implementation, as it forces shippers to alter their operations and nobody enjoys having change forced upon them. Some may even be made permanently worse off than before. But beyond the initial stages of disruption, a fluid network with more reliable delivery times is probably better for the modal shipper and the logistics ecosystem as a whole.
Second, railroads aren’t set up to handle outsized fluctuations in volume. While it is tempting to point to PSR as the primary culprit behind the service disruptions last year, consider that BNSF, who has long resisted PSR, and NSC, who didn’t start scheduled railroading until 2019, were among the 4 Class 1s harangued by the Surface Transportation Board for deficient service. In an alternative history where PSR wasn’t adopted at all, would the industry have managed post-COVID disruptions better? I’m skeptical. From what I gather, service issues emerged because railroads, like many other industrial companies, mis-calibrated the shape of demand: they were too quick to lay off employees in response to the sudden collapse in volumes early into the pandemic, leaving them ill-equipped to manage the unexpected surge in demand that shortly followed in a very tight labor market.
Third, describing PSR as little more than a brute cost cutting program gets it backward. For the most part, cost reductions aren’t the cause of efficient operations, they are the consequence. A network that has been reconfigured to facilitate car movement, leading to less yard inventory and fewer jams, should require fewer trains, fewer yards, and less labor than before. Also, while PSR adopters are sometimes accused of skimping on capital investment, the reality is murkier. While it’s true that reductions of locomotives and railcars follow from PSR-driven efficiency gains, the vast majority of a railroad’s capex is concentrated in track infrastructure. CP spent more on capex as a % of revenue in the 8 years after PSR, and over the last decade CP and CN have each spent proportionally more than PSR holdout Burlington Northern (20% vs. 17%).
On the other hand, CSX has cut back on capex dramatically, from ~20% to low-teens of revenue, since starting PSR. But I would caution against drawing hard conclusions from that because looking back far enough in history, you will often find multi-year stretches of low capex followed by big spikes. For instance, while CSX was running capex at 20% of revenue in the 6 years prior to starting PSR in 2017, in the 6 years from 2004 to 2009 they were at only 15%, right where they are today.
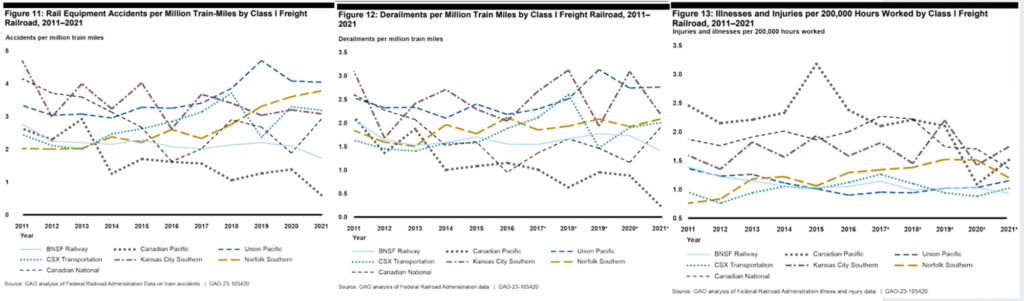
Finally, I don’t see much evidence to back the claim that resource take-outs accompanying PSR have degraded safety:
The clear outlier here is Canadian Pacific, whose accident, derailment, and injury stats have improved considerably in the decade since PSR was adopted. And CN’s injury frequency rate dropped precipitously after PSR, from 7.3 per 200k person-hours in 1999 to just 1.8 by the time Harrison retired7[13].
In a report from last December, the US General Accountability Office concludes:
Federal Railroad Administration (FRA) officials stated that data from 2011 through 2021 are inconclusive about the extent to which operational changes associated with PSR may have affected rail safety, but have taken steps to address potential risks. Class I railroad representatives generally stated that these operational changes improved or had no effect on railroad safety. In contrast, rail safety inspectors and employee unions identified safety concerns related to reductions in staff and longer trains.
In general, I find the idea that efficiency comes at the expense of safety to be a little odd in that accidents cause downtimes and are terrible for smooth operations. Can you think of an industrial company that has simultaneously sustained above average returns with below average safety? When executives declare “safety is our number 1 priority” they do so not just because it is one of those nice things you’re supposed to say to signal responsible corporate citizenship to regulators (you wouldn’t want to stand out as the only railroad not leading earnings calls with a shout out to safety) but also because safe working conditions really are a necessary precondition for operating efficiently. No altruism required. A selfish drive to maximize profits will also motivate you to minimize injuries.
I guess where I land is that 2022 was just an exceptionally disruptive year that would have confounded any railroad, PSR or not. It’s likely that some PSR programs were too aggressively implemented. But this seems more like an overshooting issue to be tweaked through tactical adjustments than an indictment of PSR as an operating model. In fact, CSX and NSC appear to have fully recovered and Union Pacific is on its way.
But if PSR has ambiguously impacted service and safety, it has been the indisputable driver of the industry’s efficiency gains over the past decade or so.
Or has it?
This seems like a silly question at first blush. After years of stagnant and below average margins, is it reasonable to think that CN, CP, and CSX would have suddenly whipped themselves into financial shape without Hunter Harrison’s guidance? Probably not.
On the other hand, most Class 1 rails were already seeing major OR reductions before they adopted PSR. This includes BNSF, who explicitly eschewed the philosophy:
So maybe the margin improvements attributed to PSR would have come even if the world had never heard of Hunter Harrison.
But I have a hard time believing that. In 2005, with the exception of CN, who was then 7 years into PSR and boasted the highest margins in the industry by far, Class 1 operating ratios were no better than they were in the early/mid-’90s. Then out of nowhere the US players, none of whom had yet explicitly embraced PSR, cut their OR by 16 points over the next decade. For me, the most resonant explanation is that Hunter’s influence seeped through every major railroad, either directly through the changes he imposed or indirectly in the pressure he created for everyone else to match the productivity gains wrought by PSR. With CN and then CP, Harrison, with the backing of prominent activist Bill Ackman, proved what was possible, both to peers but also to investors, like Roger Bannister breaking the 4-minute mile. No self-respecting Class 1 management team would have been permitted to continue reporting ORs in the high-70s/80s with CN reporting low-60s and CP trending that way immediately after HH took charge in 2012. The industry had a fire lit under its ass. Hunter was holding the match.
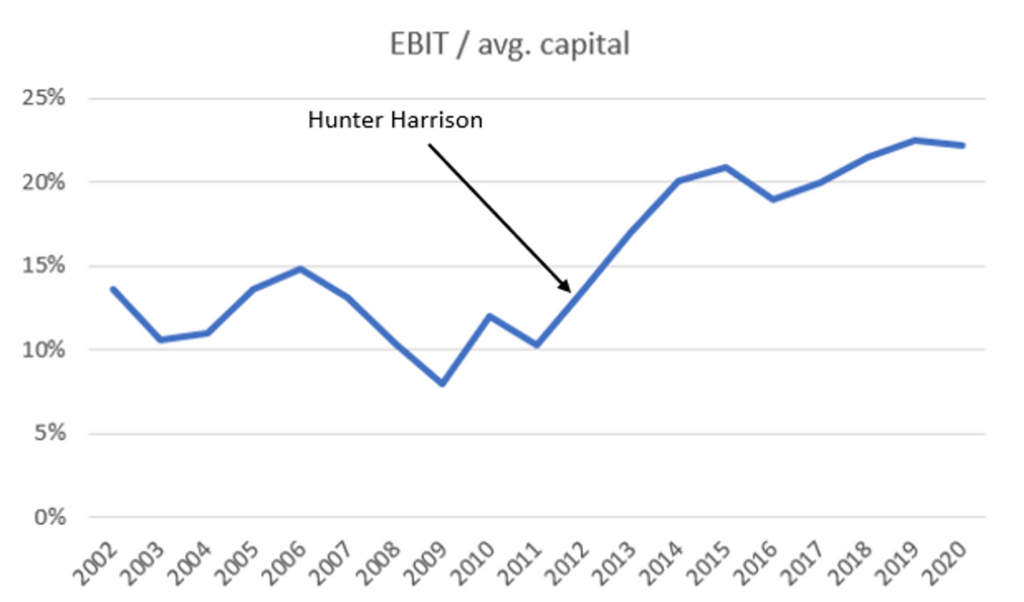
A reasonable pushback is that while PSR may have fueled margin expansion, its impact on ROIC has been more ambiguous. For CP, Hunter Harrison’s influence is clear cut and obvious.
Less so at CSX. While pre-tax returns improved from ~15% in 2016, the year just before HH came onboard, to 18% 3 years later, in 2016 the industry was still in the midst of a mini-industrial recession that it clawed out of by 2019. There is no difference in CSX’s 5-year average ROIC before-and-after PSR.
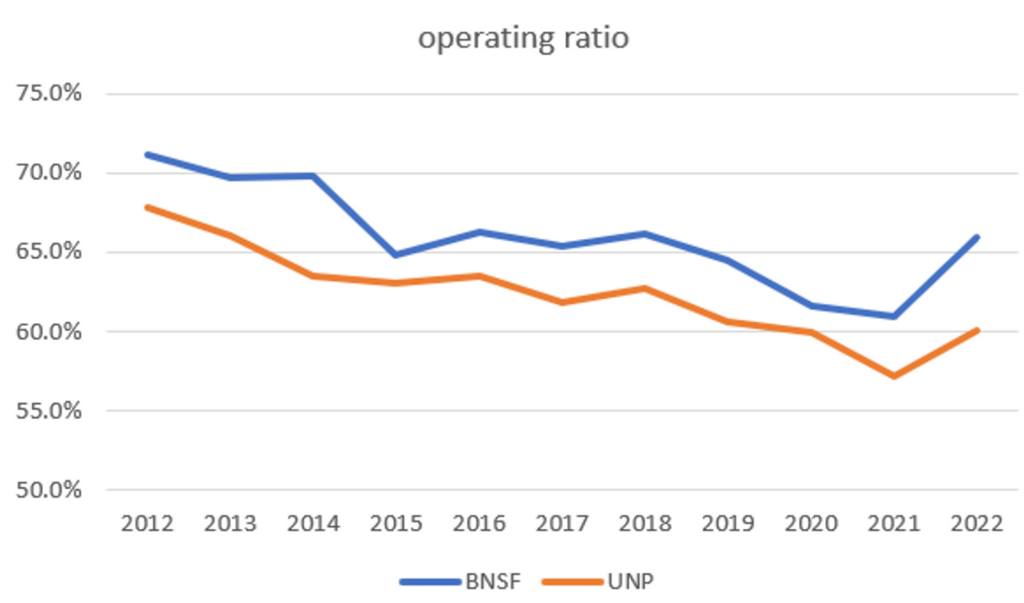
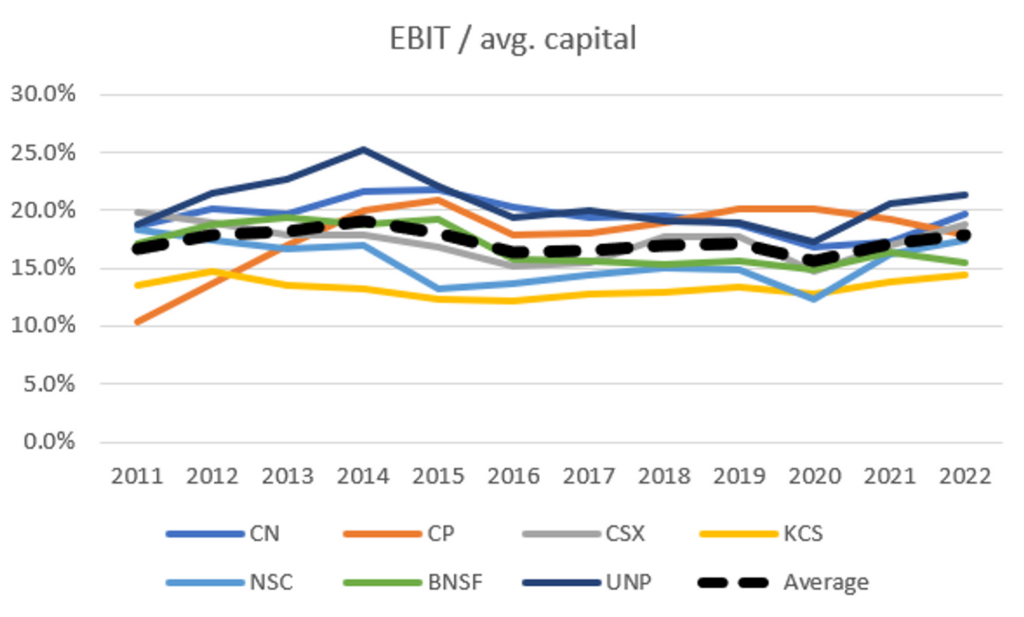
But we have to consider the counterfactual. What would returns have been under the status quo? Whether or not PSR was adopted, capital requirements would have outpaced revenue growth. Operating efficiency was the key lever railroads had to counteract this effect. Compared to UP, PSR-holdout BNSF has reported higher ORs (lower operating margins) every single year over the last decade.
Meanwhile, both companies generate about the same amount of revenue per dollar of capital, a figure that has declined by a similar amount over that period. The net result is that BNSF’s pre-tax returns on capital have deteriorated a bit over the last decade, from 19% to 16%, while UNP’s has at least remained stable at ~20%.
It’s interesting to observe that while the industry is converting revenue into far more EBIT than they did 10 years ago, every dollar of EBIT still requires about the same amount of capital to generate as before, another reminder that these are very capital intensive businesses and even significant margin gains can be a misleading indicator of the degree of value creation. But like it or not, operating ratio improvements, and the GAAP earnings growth that come along with it, move rail stocks.
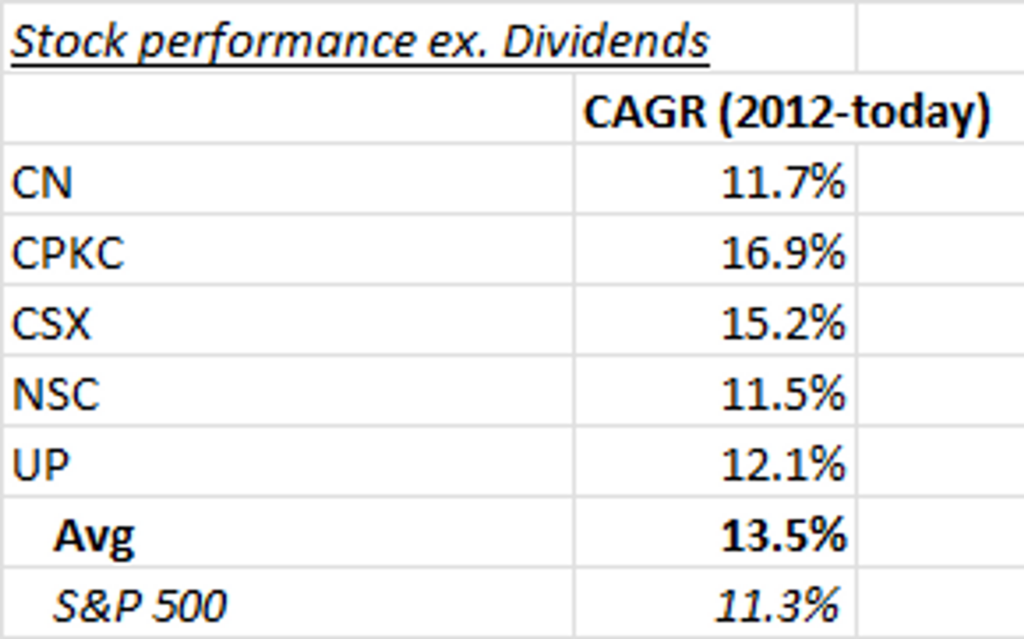
All the Class 1s except CN have compounded by low-teens and outperformed S&P 500 over last ~decade.
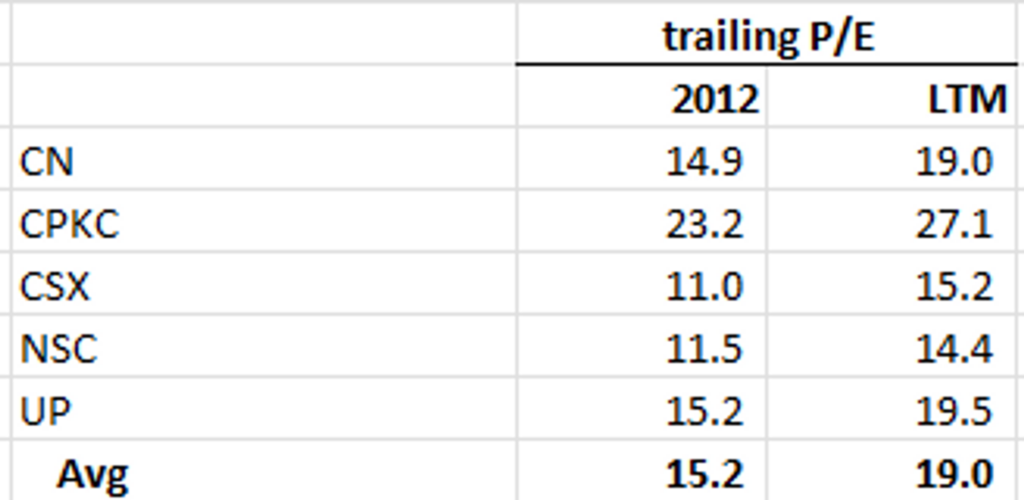
Around ~2.5% of that compounding has come from multiple expansion:
The remaining ~11% tracks per share earnings growth.
You’ll notice that CP stands out as the most richly valued Class 1 by far. I can certainly understand the valuation at the end 2012. CP had the lowest operating margin and ROIC, but Hunter Harrison had just come onboard as CEO to turn things around. Given his success at CN, there was strong reason to believe profitability would inflect. And that’s exactly what happened. The once ailing railroad went on to grow earnings per share by ~16%/year over the next decade, faster than any of its peers. Now it generates the highest returns on capital of the Class 1 rails. Even with its premium starting valuation, CP’s shares have compounded a much higher rate than peers.
But is it reasonable to expect similar performance over the next 10 years?
On the one hand, CP is steered by Keith Creel, who was Hunter Harrison’s right hand man for 30 years and has become an industry legend in his own right. With its recent acquisition of Kansas City Southern, CP is an obvious beneficiary of nearshoring. Between “base growth” (3%-4%), inflation+ pricing (3%-4%), and synergies (2%-3%), management is guiding to high-single digit revenue growth from 2024-2028 at the low end. Moreover, KCS only started its PSR journey in 2019, so on top of the revenue synergies maybe CP also surprises us with margin accretion from low-hanging productivity gains.
On the other hand, there’s a big difference between paying 23x for earnings that are about to massively inflect and paying 27x earnings that have already massively inflected! And if the low-end of CPKC’s revenue guidance for 2024-2028 (8%) is ambitious but plausible – adding ~2%/year of revenue synergies to the trailing 10-year ex. coal revenue CAGR gets you to ~7% – the high-end (11%) feels far-fetched. To put this in perspective, like CP+KCS, the last 2 major Class 1 mergers – between Burlington Northern and Santa Fe in 1995 and between Union Pacific and Southern Pacific in 1996 – also created more direct route routes across more O/D pairs. In the 4 years following their mergers, BNSF grew by 3%, UP by close to 5%. Over 10 years, both companies grew by 6%. So considering CP’s standalone historical revenue growth rates (5% over the last 10 and 20 years) and the growth rates generated by other Class 1s post-merger, the base rates supporting 8%-11% growth don’t seem all that favorable.
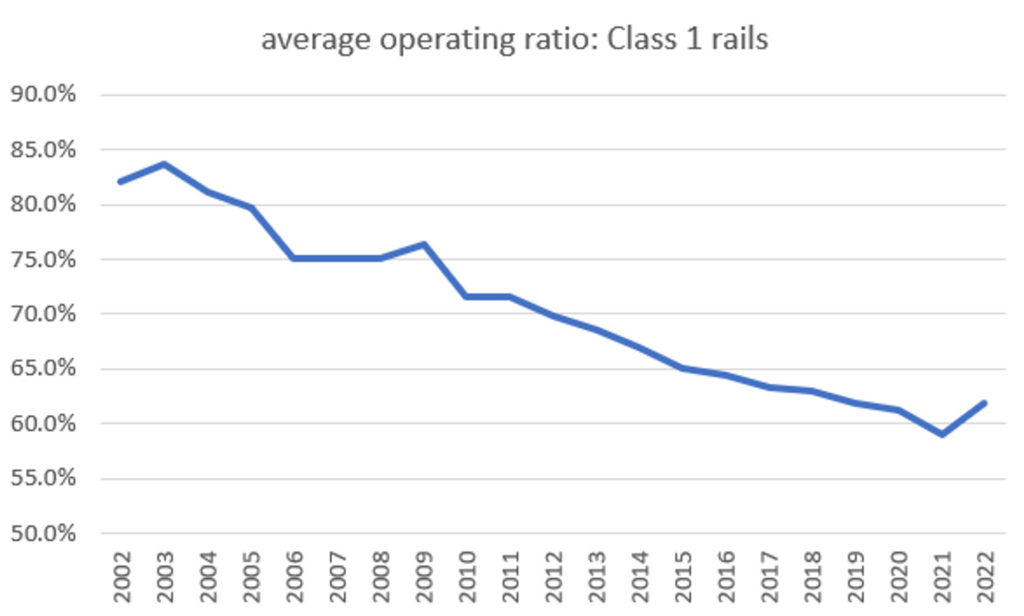
More generally, railroads have talked a big game about improving growth for years and years. But the fact of the matter is that Operating Ratio, while sometimes derided as a crass oversimplification of what really matters, seems to be the singular metric that both matters and is reliably under a railroad’s control. And the extent to which it can improve from here, after steadily compressing over the last 20 years, is a key question hanging over the industry.
In the decade from 2002 to 2012, the average Class 1 OR improved by 12 points, from 82% to 70%. Over the following decade, a period during which all major railroads (except BNSF) adopted PSR, it improved by just 8 points, from 70% to 62%. With everyone now at least 3 years into their PSR programs, is it reasonable to think the industry enjoys comparable gains over the next 10 years?
Tying OR to its operational drivers can be a somewhat helpful intuition pump…for instance, CSX’s former CEO Jim Foote noted back in 2019, when the railroad was managing an OR of 60%, that a reported velocity of 20mph implied their trains were idling at yards 60% of the time, given that a train in motion travels at speeds of ~50mph. Though I’m then left wondering what a reasonable idle percentage should be, as well as the quantitative impact that improving it has on OR? I’ll just say that generally speaking there always seem to be more ways to optimize complex operations. The constraints to doing so are often rooted in culture than in physics. After decades generating 10%-15% EBIT margins, I’m sure the dudes running large railroads in the ‘90s were convinced they had hit a natural OR floor. Who among them would have believed a network with more than 20k+ route miles could get hit low-60s? CP’s OR trundled along between 75 and 80 for a dozen years. Then Hunter Harrison lobbed off 20 points in just 4. And if you’ve ever researched Danaher, you’ll no doubt have heard stories of managers at acquired companies, cock sure that they had run the productivity well dry after decades, stunned at the gains subsequently realized through DBS. Alongside process improvements, the industry has a long history of applying technology to reduce fuel and maintenance costs – devices that automatically shut down locomotive engines to reduce idling, GPS coordinates and velocity data to better predict arrival times, machine vision systems that inspect components while the train is in motion, sensors that pickup the irregular sounds of defective bearings.
At the same time, one reason I find it hard to gauge the pace of improvement from here or to even know what a realistic OR might be is that we don’t have a benchmark to anchor to. In 2011, if you were looking at a railroad with an 80%+ OR, you could look to CN, who had sustained sustained an OR in the 60s for more than a decade, as an aspirational anchor. That’s especially true if this railroad were CP, who ran a similar east-west network in Canada. I completely get now why Pershing Square, with Hunter Harrison in tow, found this opportunity so compelling. Today though, you’re running a mile before knowing it can be done in under 4 minutes. There is no outlier OR to to show us what’s possible. A few railroads reported 55% ORs, but only for a year or two. All the rails are bunched up with ORs around 60. The difference between the highest and lowest OR is just 6 points compared to 18 points in 2011.
We should also consider regulatory obstacles. The STB is now headed by a particularly enthusiastic Chairman, Martin Oberman, who was appointed to the role by President Biden in 2021 and, according to a statement he released last year amid railroad disruptions “has prioritized enhancing competition in the nation’s rail industr[14]y where too many rail customers are captive to a single large railroad and for that reason often lack bargaining power to obtain better rail service and competitive pricing for their shipments”. The effort to “enhance competition” is expressed through a renewed interest8[15] in Reciprocal Switching rules, which require an incumbent railroad to transfer traffic to a competing railroad at a nearby interchange point in return for a fee. For the rules to take hold, historically shippers had to prove that a rail carrier had engaged in anticompetitive conduct, which was apparently very hard to do. Now, Oberman is proposing a lower hurdle that requires the shipper seeking RS relief to merely show that it is “practicable and in the public interest” or “necessary to provide competitive rail service”[16]. The proposal basically introduces competition by giving captive shippers the opportunity to source service from a nearby alternative carrier.
You can see why the Class 1 railroads hate this. They make their money hauling as much freight for as long as possible and, assuming certain conditions are met, the new RS proposals might require a railroad to transfer profitable traffic at the point where a competitor can move it more efficiently and at lower cost (according to rails.com[17], at an STB hearing in March ‘22, Oberman criticized Union Pacific[18] for routing chemical traffic from the Gulf Coast to the East coast by interchanging with competing rails at St. Louis, adding 335k extra miles a year unnecessarily).
Railroads retort that their networks have emerged through a long series of considered trade-offs that take into account differential route density, balance, and terminal congestion, and that re-shuffling the decks would throw everything into disarray, especially now that most everyone has adopted some form of precision scheduling, which requires a degree of resolution into the goings on of a network that is obfuscated by arms-length switching obligations. Accommodating interchange with competing carriers could require unplanned re-allocation of resources on short notice. The uncertainty unleashed by the proposed RS standards could disincentivize investment. Why build more terminal or storage capacity if you could be forced to interchange a competing rail’s traffic there or if you can’t accurately estimate volumes? In essence, the industry argues that any putative benefits from greater competition would be more than offset by coordination costs, operational complexity, and ultimately degraded service levels.
But the rail industry is prone to histrionics when it comes to resisting unfavorable change, like a soccer player wailing in exaggerated agony at the slightest contact. Canada has been subject to regulated “inter-switching” since the early 1900s[19]9[20], and CP and CN have long been among the two most efficient players. Also, reciprocal switching at flat fees are a common outgrowth of major US railroad mergers. Union Pacific and Burlington Northern were both forced to grant significant traffic rights to competing rails as conditions to acquiring Southern Pacific and Santa Fe, respectively, which did nothing to impede their productivity gains in the ensuing years.
In 2016, the last time reciprocal switching reform was seriously discussed in the US, Hunter Harrison remarked that in Canada few customers took advantage of “inter-switching” (as it’s known there) and predicted that just as inter-switching had “no impact” on CP’s business in Canada, it would be a non-event in the US. Of course, whether that’s true will ultimately turn on the details (we’ll know more by the end of this year or early next year). But given the systemic importance of this industry and the unpredictably large ripple effects that seemingly minor disruptions can have across networks and thus the industrial economy, I expect common sense and incrementalism to prevail over over ideology and radical change, especially now that the service disruptions of last year have largely corrected. If I had to guess, I’d say RS rules will be a fallback that shippers rely on to address blatant anticompetitive abuses rather than a bargaining tool used in the everyday course of business.
But even assuming the Oberman is more bluster than bite, I’m still left wondering how much margin expansion is reasonable from here. Let’s be optimistic and assume CPKC compresses OR by 10 points (including cost synergies from the merger) and the others do it by 8 points over the 7 years, which is about as much improvement as the industry realized over the last decade. Further, let’s assume CPKC grows revenue by 8% a year and that the rest of them grow 1 point faster than they did over last decade, ex. coal (i.e., CSX grew ex. coal freight revenue by 2.5% from 2012-2022, so I assume they grow by 3.5% over the next 7 years). With onshoring trends taking hold and ESG considerations rendering trains (4x more fuel-efficient than trucks) a more attractive transport option, it could be reasonable to expect somewhat faster growth in the years ahead, who knows. Still, I consider these growth rates more optimistic than realistic as railroads have in the past gestured at themes – whether that be rising meat consumption in emerging markets, crude-by-rail, frac sand, biofuels, energy reform in Mexico, electronic logging devices tightening truckload capacity, etc. – that, however promising, have proven small fragments in the massive mosaic of the anemic industrial economy.
With industry capex running about 1.5x-2x depreciation over the last decade, only about ~70% of net income has dropped down to free cash flow on average over time, though there is wide range across names, with CP at ~60% on the low end and UP at 80% on the high end. Let’s say “normalized” conversion is 75% and slap a year 7 free cash flow multiple of 30x on CPKC, 25x on CN and UP, and 20x on CSX and NSC, which roughly corresponds to their ordinal valuation ranking today (simplistic, I know…let’s just get through this ;). After applying those rosy assumptions, you’re still only compounding 11% on CN, 10% on CPKC, CSX, and NSC, and 9% on UNP. And let’s not forget that capital turnover (revenue/capital) has generally trended down over time and that OR gains have only gone toward compensating for those declines to maintain ROIC.
(I made an educated guess for CP in 2021 and 2022)
Were capital turnover continue to fall without a corresponding OR offset, returns on capital would deteriorate and these names could be hit with multiple compression on top of lower than expected earnings.
In short, the railroads are a mature, consolidated industry, more or less prohibited from large scale M&A. What’s mostly in their control boils down to capital allocation, which is more or less undifferentiated across Class 1s and frankly hard to screw up too badly in an industry with such high levels of long-term business certainty (we don’t need to handicap “metaverse” type bets that someone like Meta might feel forced to make to fend off existential platform concerns), and operations, where I think margin expansion will continue but at a slower pace as the most profound PSR-fueled efficiency gains have likely already been realized.
(I drew on Great Railroad Revolution and North American Railroad Family Trees for much of the historical content contained in this post. Both books are great resources if you’re interested in understanding how the North American rail industry has evolved over time, starting way back in the 19th century)
CSX: The Old School “Monopoly”[27] by Mostly Borrowed Ideas (nice overview of CSX and the North American rail industry, including some useful charts and maps)
Disclosure: At the time this report was published, accounts managed by Compound Insight LLC did not own shares of any company mentioned. This may have changed at any time since
Class 1 freight rails: part 2 – freight types, route structures, and growth
Part 1 of this series offers a historical survey of how today’s Class 1 rails came to be. Parts 2 and 3 start at the ground level with the very basics of freight carriage, build up to an understanding of how an industry that had destroyed over most of its 200-year history managed to turn […]
In the gaseous hot ball of 19th century US rail activity roils the primordial elements of American industry: a technology startling in its potential yet exaggerated in its promise by visionaries and hucksters, transformed into shape by private enterprise with government aid and later controlled and extended by the ambitious and vicious. The atrophying influence […]
If all you knew about Dun & Bradstreet was that it sold mission critical data on more than 520mn companies, that all this data was linked to its widely referenced proprietary identifier, that 96% of its customers retained every year and were mostly monetized through high margin subscriptions, you might be tempted to comp to […]
related post: [APO] ApolloCharles Schwab is broker that monetizes like a bank. They invest excess cash from brokerage accounts into government securities and keep the difference between what they earn on those securities and what they pay to clients. This worked out all right for a while: clients could earn a bit more by proactively […]
In previous posts, I emphasized the part of bioproduction where cell populations are grown in bioreactors and proteins extracted from those cells are purified. This is where Lonza, WuXi, and Samsung mostly play. Catalent does some of that too but their exposure to biologics is heavily tilted toward “drug product”, where the active substance is […]
Posted By
scuttleblurb
On
In
[CTLT] Catalent,[LONN.SW] Lonza |
Comments Disabled
Related posts[TMO] Thermo Fisher[DHR] DanaherOver the last 4 decades, a growing share of the pharmaceutical market has shifted from small molecules derived through chemical reactions to large molecules extracted from living cells. The latter process is far more difficult. Cell populations are temperamental. They need to be fed with just the right amount of nutrients […]