Moody’s is a Nationally Recognized Statistical Rating Organizations (NRSROs), a title bestowed by the SEC on a handful of credit rating agencies, the top 3 of whom act as an oligopoly in the US debt ratings gambit. As you well know, Moody’s (and S&P and Fitch) fell into disrepute during the last financial crisis when its ratings on vast swaths of corporate and securitized paper proved worthless, its grossly conflicted issuer-pay model laid plainly bare. But testament to the company’s resilient business model, and toothless fines and regulatory censures notwithstanding, Moody’s Investor Service (“MIS”, the credit rating agency side of the business that constitutes ~2/3 of revenue and ~85% of EBITDA) has thrived since the crisis, compounding revenue and EBITDA by 10% and 15%, respectively, since 2009 and generating more of each vs. the 2007 peak:
| MIS segment, $ millions | |||
| 2007 | 2009 | LTM | |
| Revenue | 1,780 | 1,218 | 2,550 |
| EBITDA | 1,021 | 543 | 1,555 |
| % margin | 57% | 45% | 61% |
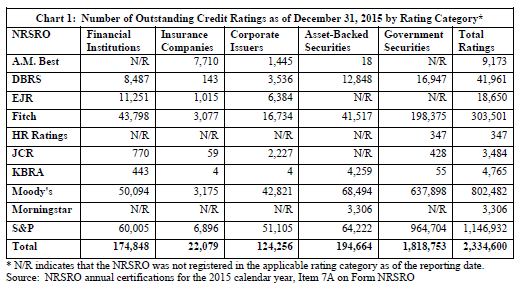
Over the last 100+ years since its founding, Moody’s ratings – derived from a consistent framework applied across 11k and 6k corporate and public finance issuers, respectively, in addition to 64k structured finance obligations – have become the veritable benchmark by which market participants, from investors to regulators, peg the credit worthiness of one debt security against another. NRSRO ratings underpin the risk weightings that banks attach to assets to determine capital requirements, dictate which securities a money market fund can own, and, in ostensibly surfacing the credit risk embedded in fixed income securities, make it easier for two parties to confidently price and trade, enhancing market liquidity. I was a research nerd in the bond group at Fidelity just prior to and during the crisis. It’s hard to overstate just how tightly Moody’s and S&P (and to a lesser degree, Fitch) ratings were stitched into the fabric of our ratings and compliance infrastructure and the day-to-day workflows of analysts and traders on the floor.
Because of such industry-wide adoption, a debt issuer has little choice but to pay Moody’s for a rating if it hopes to get a fair deal in the market: an issuer of $500mn in 10-year bonds might pay the company 6bps upfront ($300k), but will save 30bps in interest expense every year ($15mn over the life of the bond)….and each incremental issuer who pays the toll only further reinforces the Moody’s ratings as the standard upon which to coalesce, fostering still further participation. This feedback loop naturally evolves into a deeply entrenched oligopoly. In terms of total ratings issued, S&P and Moody’s are at the top of the heap. There are actually 10 NRSROs, but unless you work in credit, you’ve probably never heard of most of them (Egan Jones anyone?)
The government’s determination of NRSRO status is premised on “whether the rating agency is ‘nationally recognized’ in the United States as an issuer of credible and reliable ratings by the predominant users of securities ratings” (per this SEC report [1]), which criteria itself is in part tautologically attributable to the government’s NRSRO designation in the first place. And when things go horribly wrong and these ratings are shown to be the reactive measures that they are, the agencies simply appeal to freedom of speech protection under the First Amendment.
This is a really hard business to screw up. Who wants to rock the boat? Certainly not the staid management team at Moody’s, which thrives on 5 year plans, formulaic capital allocation policies, and farcically granular guidance that plays to the myopic expectations of sell-side model tweakers (though I give management props for expensing stock comp in its adjusted profit numbers). You will never see Moody’s carve out an “Other Bets” P&L for new innovations. Day One will always be yesterday. [If watching Sundar Pichai saunter on stage to fulsome fanboy applause against jubilant theme music from Fitz & The Tantrums provokes reflexive eye-rolling, then do yourself a favor…watch the 2016 Moody’s Investor Day webcast and take refuge in the sterile quietude of a generic albescent conference room where every cough and throat clear is awkwardly amplified against the AV projector’s fan’s sad whir.]
MIS’ 2016 revenue was about 60% transactional (tied to new debt issuance) and 40% “recurring” [per 10K: annual fee arrangements with frequent debt issuers, annual debt monitoring fees and annual fees from commercial paper and medium-term note programs, bank deposit ratings, insurance company financial strength ratings, mutual fund ratings], a mix that has been reasonably stable during the quiescent issuance environment of the last 5-6 years. Debt issuance in the US, which constitutes nearly 2/3 of MIS revenue, can be choppy from year-to-year….
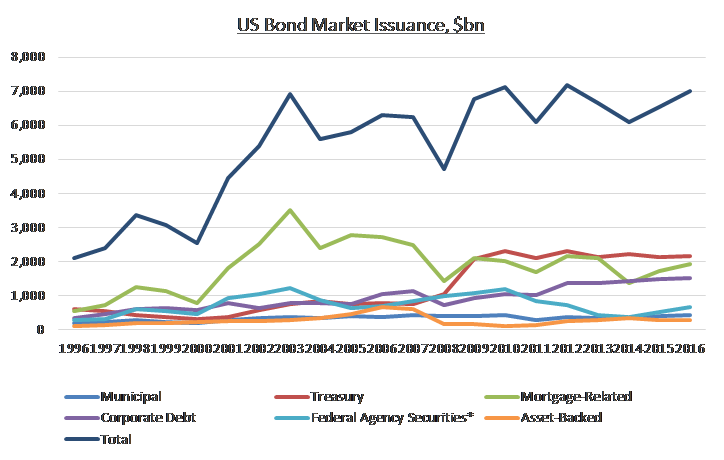
Source: SIFMA …but the overall stock of debt has been steadily growing…
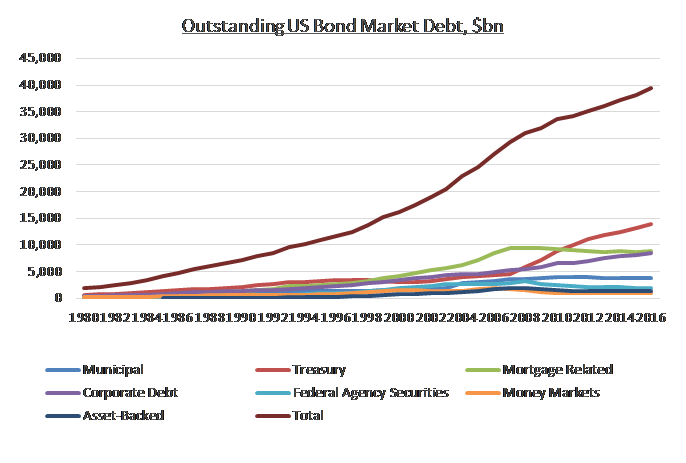
Source: SIFMA …so, as you might expect, MIS’ recurring revenue has served as a reliable anchor during stormy issuance periods.
| MIS segment, $ millions | ||
| Revenue | ||
| Transactional | Recurring | |
| 2007 | 1,204 | 576 |
| 2008 | 591 | 614 |
| 2009 | 612 | 606 |
| 2010 | 800 | 605 |
| 2011 | 903 | 666 |
| 2012 | 1,173 | 714 |
| 2013 | 1,281 | 779 |
| 2014 | 1,372 | 875 |
| 2015 | 1,419 | 902 |
| 2016 | 1,430 | 930 |
| LTM | 1,616 | 934 |
Still, recurring profits did little to cushion the punishing issuance swoon during the last recession. Revenue from corporate and structured finance bond issuance declined 26% and 53%, respectively, from 2007 to 2008, forcing a ~$575mn revenue decline that translated into a $450mn EBITDA hit.
| MIS segment, $ millions | ||
| Revenue* | EBITDA | |
| 2007 | 1,780 | 1,021 |
| 2008 | 1,205 | 632 |
| 2009 | 1,218 | 603 |
| 2010 | 1,405 | 685 |
| 2011 | 1,569 | 804 |
| 2012 | 1,887 | 991 |
| 2013 | 2,059 | 1,116 |
| 2014 | 2,248 | 1,277 |
| 2015 | 2,304 | 1,307 |
| 2016 | 2,340 | 1,255 |
| LTM | 2,550 | 1,555 |
| * excludes a negligible amount of “other” | ||
| non-ratings revenue |
We don’t know the profit split between transactional and recurring profits (and I don’t even know if such a determination is possible since labor is the biggest component of SG&A and allocating the cost of an analyst’s time between new issuance and maintenance work feels like arbitrary hair splitting). But, I think we can confidently say that non-recurring revenue per dollar of new issuance is way larger than recurring revenue pulled from each par dollar of the rated installed base, and so big swings in transactional revenue have a disproportionate impact on profitability…though, keep in mind that heavy debt issuance in a given period adds to the stock of outstanding debt and thus the monitoring fees earned in future periods.
Given the lofty contribution margins attached to new issuance, the prospect of a reversal has been a source of trepidation for me. Transactional revenue growth has proceeded at a strong, though not torrid, 12% pace over the last 6-7 years as issuers have seized on a stubbornly low rate environment to refinance debt and add leverage to their balance sheets.

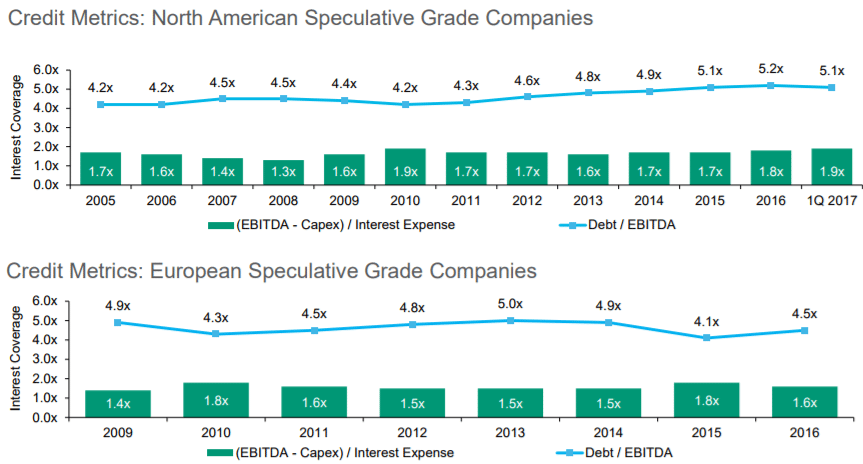
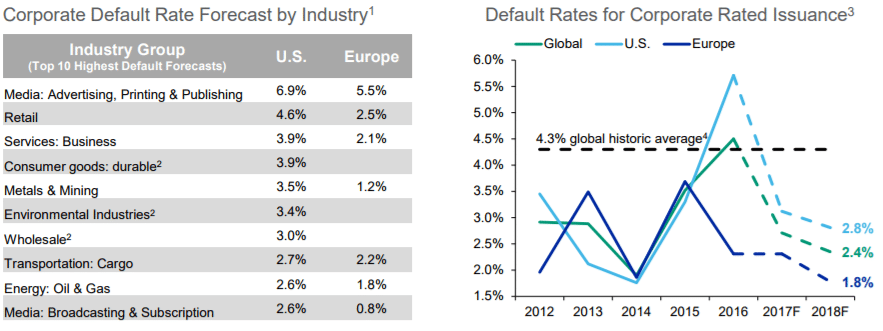
Meanwhile, outside a commodity-driven hiccup in 2016, high yield default rates are well below the historic average (which should give you pause if you believe in cycles and mean reversion).
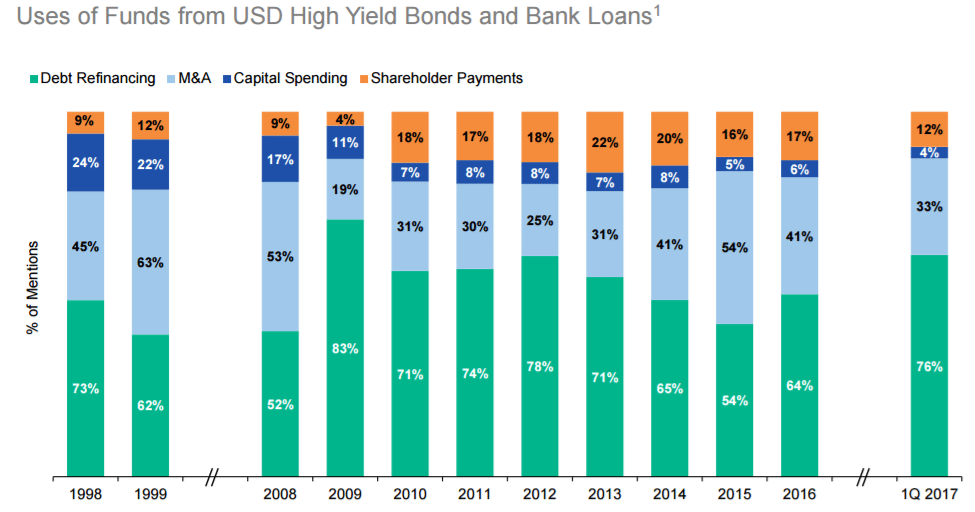
[Aside: the below exhibit, which breaks out the uses of funds from high yield bond and bank loans, is interesting in its own right. In the late 1990s, 20%-25% of companies that raised funds cited internal investment as a reason for doing so vs. just a mid-single/high-single digit percentage today.]
I’m being unhelpfully obvious when I say that credit conditions feel toppy. But even if mean reversion is impending, 2008/2009 seems an inappropriate analog since not only is the catalyst driving systemic financial concerns that loomed so large back then less relevant today, but also a significant chunk of the company’s pre-2008 profits came from its reckless rubber-stamping of toxic asset-backed securities.
| (MIS revenue, $mn) | |||||
| 2007 | 2008 | 2009 | 2010 | ||
| Structured Finance | 868.4 | 404.7 | 304.9 | 290.8 | |
| % change | -0.5% | -53.4% | -24.7% | -4.6% | |
| Non-Structured Finance | 911.5 | 800.0 | 912.8 | 1,114.2 | |
| % change | 18.8% | -12.2% | 14.1% | 22.1% | |
| EBITDA | 1,020.5 | 568.7 | 543.0 | 623.5 | |
| % change | 4.8% | -44.3% | -4.5% | 14.8% |
Disaggregating MIS’ revenue streams per above, we see that outside of structured finance, the revenue declines were actually not sooo bad during the worst financial crisis in decades, thanks of course to issuance stoked by aggressive rate-deflating monetary policy measures. Structured finance grew from just $384mn in revenue in 2002 to $873mn in 2006 (an 18% CAGR) and was so profitable that even while non-SF revenue grew by 14% in 2009, overall MIS EBITDA still declined as SF revenue contracted by another 25% from 2008’s harrowing 53% decline. I don’t believe MIS has significant revenue streams tied to comparably negligent and profligate underwriting today, and would expect the profit hit from a cyclical correction to be far more muted.
Also, due to the surge in 7-10 year paper subsequent to the financial crisis – MIS’ non-structured revenue increased by 17%/yr from 2008 to 2012 – the refinancing needs over the next 4 year period (2017 to 2020) are 30% greater than they were from 2013 to 2016, providing an intermediate tailwind to transactional revenue, though 1h17’s whopping 30% y/y growth in corporate finance revs is clearly testament to some pull-forward of refinancing needs. Debt issuance cycle aside, companies have been increasingly tapping the capital markets, rather than banks, for their debt funding needs. In Europe, bonds constitute just 23% of non-financial debt [bonds + bank loans] outstanding vs. 52% in the US, with the mix shifting in favor of bonds over at least the last decade.

Management thinks that disintermediation (+2%-3%) plus debt issuance prompted by global GDP growth (+2%-3%) plus pricing (+3%-4%) should sum up to around ~high-single/low double digit revenue growth through the debt cycle, which sounds reasonable to me and is consistent with the 9% revenue CAGR MIS has realized since 2011. And on top of that, there’s another 2%-3% contribution from Moody’s Analytics, MCO’s less good business segment that offers a range of risk management, research, and data products and services, and constitutes about 1/3 of revenue and 16% of EBITDA (corporate overhead is already allocated to business segments). Almost all of the ~$1bn that the company has spent on acquisitions (out of cumulative free cash flow of ~$8bn) over the last decade through 1q17 has gone towards bolstering MA, mostly small tuck-ins.
Then, on May 15, 2017, management announced the €3bn acquisition of Bureau van Dijk. Moody’s is spending 3x more on this one acquisition than it has on the sum of all previous acquisitions over the last decade. BvD is an Amsterdam-based company that aggregates data on 220mn private companies across a wide range of geographies and industries and makes it available in hygienic, organized form to 6k corporate and government customers. This acquisition will be “tucked into” RD&A [In 2016, about 54% of MA’s revenue came from “Research, Data, and Analytics,” which is really just an extension of MIS insofar as it realizes revenue by selling research and data (analysis on debt issuers, economic commentary, quantitative risk scores, etc.) generated in MIS. The quality of RD&A mirrors that of the ratings segment, with 95% retention rates driving hsd revenue growth (90% organic) from hsd pricing and volume since 2011], boosting its revenue by ~43% (and contributing ~8% to MCO’s total revenue). BvD does not own the data, but rather licenses it from 160mn obscure data providers in various jurisdictions before “cleansing” and standardizing it for subscribers who use it to, for instance, better assess credit risk, conduct M&A due diligence, set transfer pricing reporting policies and docs for multinationals, and identify potential B2B sales leads.
Management claims that this business benefits from network effects, by which I assume they mean that the license fees BvD pays to suppliers are pegged to the number of users of that data and so more users compel more suppliers to make their data available to BvD, which in turn draws more users. Going off the high-level historical financials provided by Moody’s, BvD has performed like a truly kick-ass asset, with revenue expanding at a steady 9% CAGR (all organic) over the last decade, growing every year right through the recession, and EBITDA margins expanding from 39% in 2006 to 51% in 2016. But great assets go for great prices. MCO is paying a lofty 12x revenue and 23x EBITDA at a time when its own stock traded at “just” ~14x at the time of announcement. €3bn is triple what private equity firm EQT paid for BvD less than 3 years ago. One might argue that if we extrapolate the last decade’s 12% annual EBITDA growth out 5 years (which might actually be reasonable given the seemingly predictable, consistent nature of the business) and apply estimated out-year synergies ($40mn revenue / $40mn costs), we’re looking at €295mn in 2021 EBITDA, which puts the multiple at ~10x, but even management concedes that it is reaching on valuation and falling short of their typical 10% cash yield target on this one. The revenue synergies seem fairly modest (14% of revenue, 5 years out) and sensible on the surface. For various reasons BvD has found it difficult to break into the US market (unlike regions outside the US, financial data on private companies in the US is sparse…plus, BvD who?) and still derives 3/4 of its revenue from Europe.
Moody’s can bundle BvD’s datasets into MA’s analytics products and sell a more robust bundle to its US customer base. [Notably, MA already feeds BvD’s data into the loan origination solution it sells to financial institution clients and some MA customers already use BvD data to drive their credit models] and cross-sell MA products into BvD’s customer base. Finally, BvD’s dataset on smaller, private companies gives MIS the opportunity to provide credit ratings to the underserved SME market, though this seems like a more distant aim. [Here’s a high-level summary of Moody’s business mix post-BvD; MA gets a nice margin lift and its EBITDA increases from ~17% of consolidated to nearly 1/4.]
| (MCO LTM + BvD 2016, $ millions) | |||
| MIS | MA | MA+BvD | |
| Revenue | 2,550 | 1,272 | 1,560 |
| EBITDA | 1,555 | 290 | 438 |
| % margin | 61% | 23% | 28% |
Still, most of management’s justifications – the acquisition reduces the volatility of the ratings business, is accretive to per share earnings, accelerates growth forecasts, gets the company access to new revenue opportunities like transfer pricing and tax planning that have little to do with the core ratings business – have jack to do with value creation and reek of generic Wall Street pandering. And while BvD’s business seems good enough on its own merits that I don’t think the acquisition will be grossly value destructive, it’s tough to credibly claim that much incremental value has been added at this lofty purchase multiple.
Outside of RD&A, there are two other business lines: 1) Enterprise Risk Solutions (11% of post-BvD revenue; risk management software and services…basically, financial institutions use Moody’s tools to create credit, market, and operational risk tables and make them available to their regulators; has grown revenue by ~11% organically over the last 8 years) and 2) Professional Services (4% of post-BvD revenue; financial training and certification, mid-single digit organic revenue growth since 2008….seems like a pretty mediocre business, but one which management insists is an important entry point to the customer). Taken as a whole, Moody’s Analytics is just “meh” compared to other data and analytics peers, in my opinon. Great analytics businesses tend to have self-reinforcing data feedback loops, which are not very relevant to MA.
[Here is what I wrote about Verisk: The company sits at the center of a network that procures data from a wide variety of sources on one side (claims settlements, remote imagery, auto OEMs, name your buzz word – smart cars, smart watches, smart cities) analyzes it, and spits out predictive risk and customer insights to their clients on the other (insurers, advertisers, property managers). The agreements through which a customer licenses VRSK’s data also allows the company to make use of that customer’s data, so essentially the customer pays Verisk for a solution that costs almost nothing for the company to deliver and Verisk gets to use that customer’s data to bolster the appeal of its own products, which improved solutions reduce churn and attract even more customers (and their data) in a subsidized feedback loop.]Its solutions seem more akin to templated reporting and risk management to sate regulatory requirements than data-fueled machine learning algorithms to drive business outcomes. Management continuously talks about realizing synergies from tuck-ins and driving operating leverage, but the fact of the matter is that MA margins have gone nowhere for years and I think it’s fair to say that this side of the company has disappointed expectations. So, stepping back…nearly 80% of MCO’s pro-forma EBITDA comes from a ratings business that has long established itself as the de facto credit risk benchmark, relied upon by all significant players in the fixed income ecosystem. But while MIS is a structurally advantaged business that will continue heaping value over time, because 60% of MIS is high-margin transactional revenue tied to new issuance, it is also unavoidably cyclical, and conditions today seem about as good as they will get. Through the cycle, MIS is a steady high-single digit revenue / low-double-digit EBITDA grower generating prodigious free cash flow (30% of revenue converts to free cash flow). Most of it will be mechanically dedicated to buybacks and dividends, which is probably just as well since its tuck-in acquisitions have had little to show, and I suspect the same will be true of BvD. At $134, the stock trades at 18x/23x my estimate of pro-forma LTM EBITDA/cash EPS. The EBITDA multiple is about as high as it has been in decades (matched only in late 2005/early 2006) on what in retrospect will likely turn out to be cyclically peak earnings. Moody’s is a great business and is priced accordingly, though with a long enough time frame, a buyer will probably do just fine even at the current valuation.