Beneath the bustle of a used car lot lies a swarm of activity that few of us have ever seen, a thriving ecosystem of wholesalers, rebuilders, parts recyclers, insurers, and intermediators whose trading activities usher some vehicles to dealer lots for resale and others to repair shops or salvage auctions. Roughly 45mn used cars are sold in the US every year. 10mn+ of those are consumer-to-consumer private transactions that take place on eBay, Craigslist, and the like. The other ~30mn+ are captured by a fragmented base of over 40k used car dealerships (CarMax, Penske, Asbury, etc.) strewn across the country, 10mn of which are sourced through wholesale auctions…so, you might trade in your Chevy Bolt for a new Toyota Camry, but that Toyota dealer doesn’t want a Chevy sitting on the lot and so will sell that trade-in at a wholesale auction, through which the vehicle will find its way to a GM dealer. This being an auction market with two-sided network effects, wherein buyers attract sellers and sellers attract buyers, you will not be surprised to learn that value lopsidedly accrues to just two companies – KAR Auction Services, through its ADESA subsidiary, and Cox, through its Manheim subsidiary – who together process ~70%-75% of the market. This is not the only oligopoly in the auto value chain.
The salvage market is also an auction and, in the US, also dominated by two companies, Copart and Insurance Auto Auctions (IAA), who each have roughly ~40% share, with the next largest operator claiming just 3%. But unlike the whole car auction market, which is closely tied to transaction “flow”, salvage auto auctions are supported by the “stock” of outstanding vehicles, providing a stable source of volume as every year some reasonably predicable percentage of the ~280mn cars on US roads get into accidents and sometimes those accidents are serious enough that the cars involved must be pulled off the road entirely. Around ~13mn are removed from the fleet every year(1), of which 4mn are siphoned to salvage auctions that are more likely than not operated by either Copart or IAA. Insurers bring 80%-85% of the cars that run through these auctions, though no single customer accounts for more than 10% of Copart’s revenue.
The other side, the buyer side, is more fragmented: sometimes dealers or repair shops buy the whole car and rebuild it, sometimes they dismantle it for parts and, in the case of LKQ, sell those parts to collision repair shops, who buy from LKQ to appease cost conscious insurers directing huge repair volume to shops using less expensive recycled parts for damaged cars. I’ve heard LKQ described as a business with low entry barriers, but actually, it can be quite difficult to replicate the scale advantages of a disciplined distributor with relatively superior local route density. Tens of thousands of mom-and-pop collision and mechanical repair shops receive unexpected service requests that must be expeditiously handled. Under pressure from insurers, who account for 85% of car repairs and who expect rapid and cost effective service, shops will buy from distributors that can most rapidly deliver the broadest range of SKUs with the shortest lead times at the lowest price, so clustering facilities in such a way that they can be economically loaded with inventory from a regional hub and also near customer premises, affords scale advantages.
Logistics/distribution-type companies with the loftiest returns – Fastenal, MSC, Old Dominion, Copart, Rollins – strongly bias towards organic growth and small tuck-ins relative to peers who undertake splashy “strategic” or “platform” acquisitions. High return stalwarts expand by methodically adjoining adjacent service territories to an existing, heavily utilized logistics base. As I wrote in a prior post:
“FAST is a prime example of how disciplined incremental expansion into adjacent product and geographic space can build to significant competitive advantages over time. In the Company’s case, we see this along three different vectors: 1) geography – from its Midwest origins the company expanded into nearby surrounding territories, building local market density that offered scale advantages in distribution and higher service levels at lower cost to customers; 2) product – FAST leveraged its existing strength in fasteners to expand into non-fastener maintenance and supply; 3) business model – the company is now building on its legacy distribution and store network to offer onsite customer service at a cost that most competitors can’t match.”
Expanding incrementally and leveraging local incumbency is not the path that LKQ has taken. The company has grown its revenue base from less than $1bn in 2006 to over $10bn today largely on the back of acquisitions. It has done 260 of them since its founding in 1998, pushing its presence beyond North America to the UK and continental Europe; beyond recycled auto parts to aftermarket products and accessories distribution for specialty vehicles (RVs and trucks). I don’t know this company intimately well, but its growth strategy feels rather unwieldy, its operational discipline wanting. EBITDA margins in North America, its most mature segment, have expanded by just 80bps over 5 years while European margins have declined. A bull might claim that its profitability profile is distorted by acquisitions, especially in Europe, and that those margins are really expanding on a “look through” basis, but I could just as easily argue that a key source of value extraction in logistics roll-ups comes from layering incremental demand atop existing infrastructure and routes, so margins should be trending persistently higher, roughly concurrent with the tuck-ins themselves.
Rollins, which regularly funds mom-and-pops with internally generated free cash flow; shuts down those acquired branches; and consolidates their customers onto existing routes, has seen its EBITDA margins inflate by over 300bps since 2012 on low/mid-single digit organic growth that is comparable to LKQ’s North America segment. LKQ boasts #1 share in a variety of international markets, but the company purchased that distinction, and as auto parts distributors and the insurers who dictate repair flow operate locally, what is the synergy that LKQ brings to these far flung territories? In its hypothetical pro forma acquisition scenario slide, management claims it is buying companies at just under 5x year-2 EBITDA (8x trailing)…and yet the company’s consolidated returns on invested capital, at ~10%, are unimpressive and have gone nowhere for 14 years. Nor are the low-teens EBITDA margins in North America, the most mature and highest margin segment, indicative of what is typically delivered by a dominant, best-of-breed distributor with massive scale advantages. Auto insurers are a pretty consolidated bunch, with the top 10 accounting for 70% of written premiums. They are offsetting claims cost inflation by pressuring repair shops to use recycled parts that sell for half the price but are nonetheless just as reliable as OEM replacement products, a significant demand tailwind for distributors of recycled salvage parts.
LKQ’s high single digit national marketshare is many times larger than the next largest distributor – competitive differentiation derived from scale economies is relative; it is usually better to have 5% share of a market whose second largest player accounts for just 1%, than to be one of ten players who each have 10% – and so bulls have argued that LKQ is favorably positioned in a static Porter’s 5 Forces framework against the 10s of thousands of defenseless, commodified, and fragmented collision and mechanical repair shops that comprise its customer base. But saying that LKQ has dominant share in North American parts distribution obscures meaningful nuance – i.e. a chain of repair shops may have negligible market share nationally but a dominant presence locally – and says nothing about the change in relative share. Insurance carriers are looking to streamline their claims operations and directing ever more repair flow to a limited number of service providers. This, combined with the growing complexity of auto repairs, which require shops to invest in costly specialized equipment and training, is in turn fueling consolidation among repair shops, whose ranks have dwindled from 65k in 1990 to around 30k today.
Since 2000, the proportion of repair volumes handled by multi-shop operations (MSOs) has gone from ~10% to nearly 40%. Against that context, LKQ’s national network may position it to win a growing share of broader distribution agreements from ever consolidated repair chains, but since the company would no longer be dealing with small mom-and-pops, its relative bargaining position is worse off. Nor does LKQ appear to have meaningful procurement leverage. Even as the largest buyer, LKQ does not comprise even 4% of the total cars sold through an auction industry that is run by just two players. And if you want to argue that LKQ has sourcing advantages outside of salvage, well, where is it? Gross margins have deteriorated over the last 7 years, from 44% in 2010 to 39% in the last 12 months. I don’t think LKQ is a bad company; it just doesn’t seem as sweet an opportunity as typically pitched, in my opinion.
To the extent that the bull thesis rests on responsible international expansion and a favorable view on the broader trends driving accident rates, Copart and IAA seem like superior bets. About those trends. When a car gets into an accident, an insurer must determine whether or not the vehicle is worth saving. It does so by comparing the cost of repairing the car versus the amount it could recognize by deeming the vehicle a total loss and selling it at a salvage auction. So, if a car was valued at $10k before the accident and it takes $6k in repairs to restore the car to its “pre-accident value” and another $1k to supply the claimant with a rental while his car gets fixed, then the insurer will choose to send the car to salvage if it thinks it can get more than $3k for it at auction [that’s $10k less $6k less $1k], and repair the car otherwise. The proportion of cars deemed a total loss has been trending higher over the last several years, driving growth in salvage auction volumes:
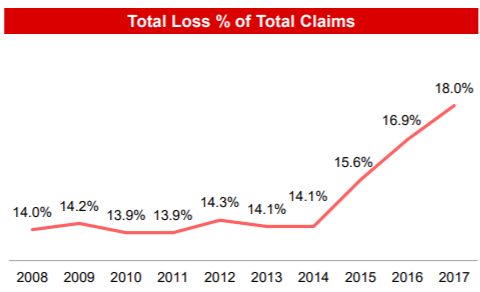
[In the early/mid ’90s, the total loss % was more like 10%] For every 5 cars that get into accidents, 1 is sent to a salvage auction, where it might be claimed by recycler like LKQ who sells the parts used to repair the other 4. Ever year, cars are being decked out with more and more safety features and technology – airbags, crumple zones, computer systems, cameras, sensors, navigation systems – making them more expensive to repair and more likely to be deemed a total loss when involved in an accident.
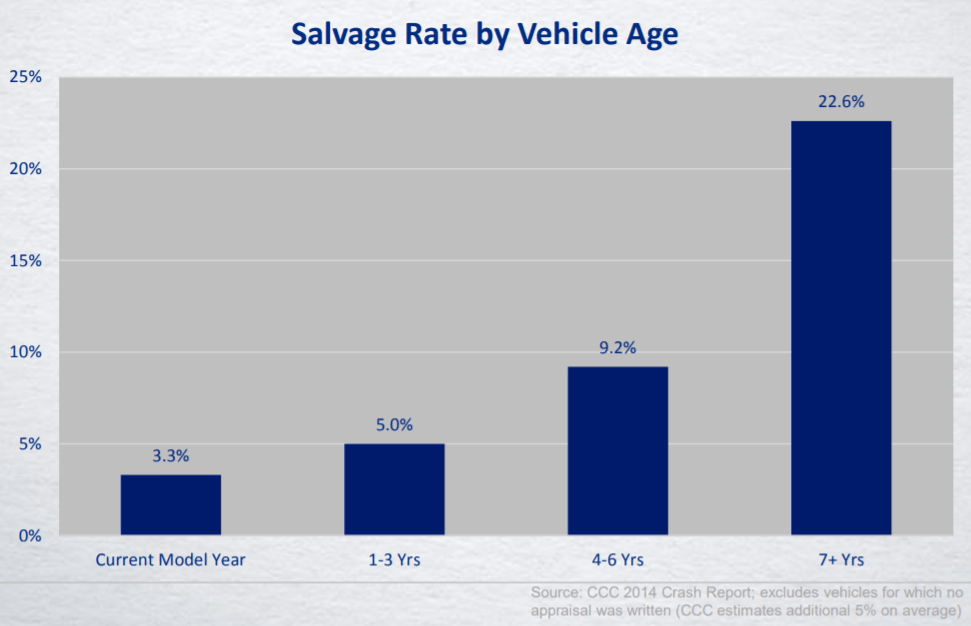
Moreover, mounting consolidation among repair shops, which attenuates LKQ’s bargaining power relative to its customers, conversely helps Copart and IAA, as these MSOs exert pricing power and exacerbate the rising the cost of repairs. Meanwhile, the demand for cheaper recycled parts, which acts as a significant tailwind for LKQ, also helps Copart and IAA as recyclers participate in salvage auctions to source totaled cars for parts inventory. Furthermore, the median vehicle age has gone from ~10 years a decade ago to ~12 years today while the percentage of really old cars in the car parc, those 11 years and older, have grown from 33% of the car parc to over 40%. Older cars are more likely to be salvaged because their repair costs make up a relatively high proportion of pre-accident value, all else equal.
Total loss claims will be further buoyed to the extent that the impending deluge of vehicles coming off lease pressures used car prices (“pre-accident” values will be lower).
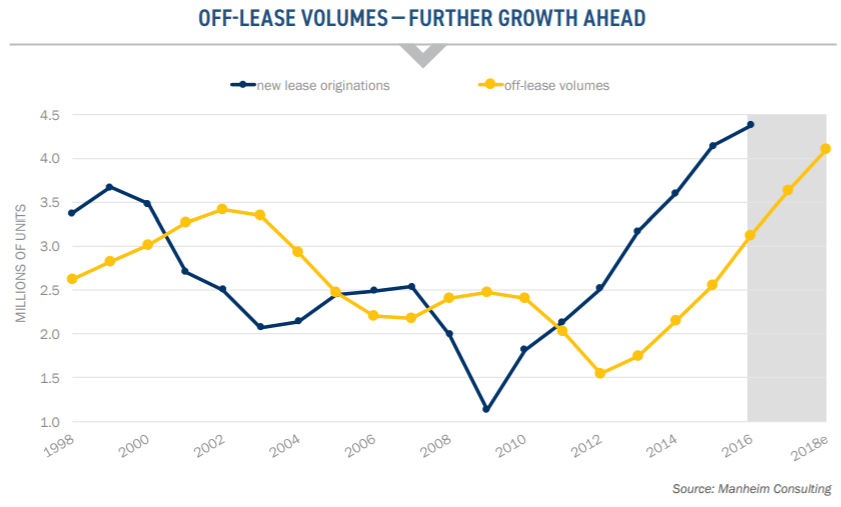
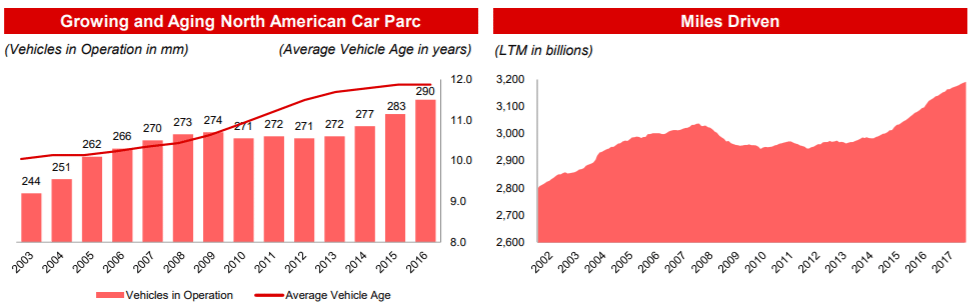
[At the end of its lease term, typically ~3 years, a car is returned to the captive finance company, who funnels it to either the wholesale or salvage auction market. The growing proportion of leased cars in recent years – in 2010, less than 13% of new car transactions were leases; today, that figure is over 30% – continues to provide some support to salvage volumes, but keep in mind that captive fincos are a subset of the less than 20% of Copart’s auction volume derived from non-insurance companies, so it’s not a huge deal(2)] So, repair costs and salvage auction participation are both going up while, speculatively, used car values are probably going down. The diverging trends provide a happy tailwind for salvage auction activity. On top of all that, the number of car accidents has been rising along with the number of cars on the road (and correspondingly, the number of miles driven)…
…and after a 15 year stretch during which the number of crashes per million driven miles declined, the crash rate has ticked higher in recent years, supposedly boosted by texting/emailing while behind the wheel: over 30% of respondents from an AAA Foundation for Traffic Safety survey reported texting while driving in the last 30 days; the National Safety Council claims that 1 in 4 crashes is influenced by cell phone use. But, even if this troubling trend proves to be a fluke that reverses, salvage volumes should still continue to grow as they have in past decades, when falling accident rates were more than offset by rising total loss frequencies (which latter are mainly a function of repair costs relative to used car prices, which I’ve already explained are trending higher).
You’ll notice that the constituent drivers of Copart’s revenue growth have naturally offsetting properties that promote growth even when times are bumpy for the auto industry as a whole. For instance, lower average used car prices, in isolation, are ostensibly bad since over half the company’s service revenue [fees charged to vehicle sellers and buyers] is correlated in some way to the selling price of the vehicle…but weaker prices also increase the proportion of repair costs to pre-accident values and makes it more likely that the a car will be totaled rather than repaired. In FY09 (ending July 2009), Copart’s service revenue shrank by less than 1% y/y, as higher salvage frequency and market share gains substantially counteracted the harrowing fallout of the last recession, including not just weaker used car prices, but the headwinds of dollar strength (around 30% of the cars at Copart’s auctions go to international buyers), commodity weakness, and a shrinking car parc. [Cars that are discontinued or built by manufacturers seeking bankruptcy protection, as occurred during the last recession, see their resale values impaired, which also helps salvage frequency.]
Still, looking past the cycles, we have to contend with the longer-term secular trend towards autonomous transportation. Where will pools of value accrue in what will surely be a dramatically transformed ecosystem of OEMs, mechanical parts suppliers, electronic component vendors, repair shops, dealers, etc., and what are the knock-on effects to parking lots, gas stations, urban planning, emergency room visits, and whatnot? I certainly don’t have the answers, but at least on the first question my best guess is that the hardware components enabling autonomy – sensors, LIDAR, cameras – will eventually be commodified and value will flow to those owning the mapping and autonomous driving software required to optimize routes and maneuver through surrounding environments. I’m less sure that excess profits accrue to those purely matching riders to cars because, notwithstanding the cross-side network effects between drivers and riders, the question of customer ownership is rendered fluid by the fact that the drivers (or, eventually, autonomous cars) are not captive and rider switching costs are low.
Mapping and autonomous software benefit from machine learning empowered data network effects – more traversed miles translate into more granular maps and driving scenarios that better utilize and make smarter, all the vehicles in a service fleet – so, a dominant ride-sharing service or autonomous car manufacturer today might bootstrap its way to a competitive advantage founded on maps and software. I don’t know. But 20 to 40 years from now, when fully autonomous vehicles can be readily beckoned in most major metros, there will surely be far fewer accidents than there are today (driver error accounts for 90% of all accidents)? They may get so good, in fact, that a lot of the expensive safety features found in cars today are obviated away. Both developments carry existential undertones for salvage auctions, whose volumes are influenced by both the frequency of accidents and the severity of damage (as measured by repair costs per damaged vehicle).
Copart’s management put out a presentation several years ago that in “skate to where the puck is” fashion, cited some surveys and expert opinions purporting that consumers are resistant to self-driving cars and that the skills of autonomous vehicles do not rival those of human drivers. In the same presentation, management pointed out that there are ~260mn cars on the road and, assuming a ~17mn SAAR and an average car life of 15 years, it takes a really long time for new technology to meaningfully penetrate the car parc. But autonomous vehicles will make a significant impact on accident frequency well before they take over the car parc as every fully functional autonomous vehicle lowers the odds of collision with several other vehicles. How long it will take before we get to a point where this starts to matter is, of course, an open question. With respect to salvage auction volumes, we may be in a sweet spot today where technology is making cars more complicated and expensive to repair and safer for drivers who do find themselves in an accident, but is not yet good enough to materially reduce the frequency of accidents that is at least partially attributable to the modern day scourge of smartphone addiction…and, I can see this state of affairs persisting on the 5-10 year time frame that is relevant to me (and many of you). As long as that’s the case, salvage volumes will likely continue plodding along at a high-single digit rate of growth – fueled by a low-single digit growth in claims, a growing proportion of which result in total losses due to rising repair costs – and value will continue migrating to the two largest players, Copart and IAA, who together share 80% of the US market.
Both companies have built up scale advantages over 35 years that would be very difficult to replicate. [IAA got into the salvage vehicle business in 1982, the same year as Copart. It went public in 1991, grew through a series of acquisitions, was acquired by private equity in 2005, and together with ADESA was merged into KAR auction services in 2007. IAA is now in the process of being spun-off of KAR.] An insurer tries to minimize its claims costs by either minimizing repair costs on the cars it saves or by maximizing the salvage proceeds for those it deems a total loss. The latter is best achieved by creating competition among a large base of potential buyers, who in turn seek a reliable source of supply across a broad range of models…buyers attract sellers and sellers beget buyers in the feedback loop characteristic of marketplaces.
Way back in the day, Copart’s salvage auctions were conducted locally, so if you wanted to bid, you’d have to drive to the physical auction site and position yourself among a throng of other buyers before a gavel-dropping, magaphoned auctioneer (“going once, going twice…”). This meant that buyers and sellers were sourced from a tight radius (~150 miles) and that the cross-side network effects were geographically confined. But the boundaries of the auction have expanded, thanks in large part to internet enabled bidding. [Beginning in fy04 (ending July), Copart embarked on a journey to conduct all its auctions in online. These virtual auctions are split into two phases. In phase 1, which starts 3 days before the “real”, live auction, buyers submit the maximum price they are willing to pay for a vehicle and Copart’s system incrementally bids up to that price on behalf of the buyer, who receives an email if he is topped. The winning bid in phase 1 sets the starting price in phase 2, when bidders compete in a real time virtual auction environment.] Online auctions have made it far more convenient for buyers from faraway locations to participate, regardless of weather conditions, resulting in more competing offers from buyers, higher realized prices for sellers, and indirectly, more revenue for Copart, whose transaction fees are partly tied to vehicle selling prices. Today, nearly half of Copart’s auctioned vehicle volumes are sold to buyers residing outside the state where the vehicle is being auctioned [30% to out-of-state buyers inside the US; 20% to international buyers].
To be fair, KAR, which runs both physical and online auctions, disputes the notion that running purely digital auctions delivers higher selling prices, contending that online auctions cannot replicate the action and excitement being there live, in person. Yet, half of IAA’s vehicles are sold to internet buyers. While this is well below the over 80% of salvaged vehicles that receive an internet bid – implying that the topping bid more often than not comes from someone on the ground – the realized selling price would likely have been lower without incremental demand from the online channel. And virtual bidding brings other benefits besides: it takes out the operating and capital expenses required to run live auctions (though these are somewhat offset by the incremental IT expenses required to run auctions online), allows buyers to bid in multiple auctions simultaneously, and speeds up auction sales since, as described in the brackets above, some of the price discovery occurs in the preliminary phase leading up to live action.
While bidding may be just as easily done online as in person, having a physical presence still matters a lot because of transport costs. Copart relies on third party haulers to move damaged vehicle from the towing company to one of its ~200 storage facilities (or “yards”) and to then take the car from the yard to the buyer. Too few sites will result in obstructive crowding at existing locations and higher transport costs, which get passed down as higher transaction costs to buyers and sellers, making the venue operator less competitive relative to someone with more locations. A dense yard network helps in cost effectively sourcing damaged vehicles…and the more vehicles you have running through your auction, the more bidders you will attract, and the better returns you will earn on yard investments(3). It also allows Copart to strike regional and national supply agreements with insurance companies. These two instantiations of scale – the lower unit costs of operating a network of physical yards and the network effects of an auction – have reinforced one another for over 35 years, producing a system that supports 1mn vehicle searches/day and attracts 44mn bids/year to find homes (or graveyards, as the case may be) for over 1mn damaged vehicles. [Besides the fees that it takes from both the buyer and seller in each transaction, Copart also offers various ancillary services. One of these services is a salvage estimation tool called ProQuote that leverages the millions of data points it has gathered through its auctions – including make, model, year, severity of damage, season, scrap metal prices, and proximity to ports – to arrive at ever more accurate predictions of how much a damaged vehicle would get in an auction, allowing insurance companies to make wiser repair vs. salvage choices…so, data network effects are a third kind of relevant scale, albeit of much smaller importance].
Management has moreover complemented these scale advantages with operating discipline and thoughtful capital allocation. Rather than pulling an LKQ – levering its balance sheet and spraying capital at far flung markets – Copart has taken a more measured approach, investing around a quarter of its free cash flow into acquisitions over the last decade to infill existing markets and gain toeholds internationally, bolstering those new geographies with tuck-ins and organic development. Because Copart’s online auction format produces a globally distributed buyer base, when the company lands in a new market, it brings with it 750k registered members from around the globe, such that, as management put it, “when we open up in a market like the UK, we start selling motorcycles in the US.” This is different from a distributor like LKQ, whose scale economies are predominantly local. Copart’s International EBITDA margins are still below those in the US (30% vs. 39%), but the key point is that margins have trekked steadily higher, from just 23% in FY14 (when management first broke International out as a separate segment) and will continue doing so as the company densifies these markets and scale economies kick in.
Eventually, I don’t see why margins in Copart’s international markets – UK, UAE, Bahrain, Oman, Brazil, Spain, India, Ireland, and most promisingly, Germany – can’t rival those of the US. You could even make the case that the relative value proposition that Copart offers is stronger in continental Europe. The European market differs from the US in that insurers there reimburse policyholders only for the diminished value of the damaged car. It’s up to the policyholder to sell the total loss vehicle in order to recover the rest. With Copart’s model, the policyholder is reimbursed for the insured amount and can replace his damaged vehicle right away; the insurer takes on the responsibility of placing the car in auction, but, if recent auction results are any guide, realizes a higher return relative to existing remarketing methods; and the buyer, who often had to wait up to 3 weeks to know if his bid was accepted, now gets a steady, reliable flow of inventory. Everyone wins. It is then perhaps no wonder that the number of participants and unique bidders per auction are higher in Germany now than they are in North America, despite the former market’s relative immaturity.
And then there are the buybacks, which are lumpy and sporadic, as they should be. Included in Copart’s share repurchase history are two big Dutch tender offers – one in 2011, in which it retired ~14% of its share count and another in 2015, where it took out another ~11% – executed at prices that were a fraction of where they are today (~$10 in 2011 and ~$19 in 2015, split-adjusted vs. the current share price of $56), at earnings multiples significantly below current levels [management did not tender any shares in either of these auctions]. That the company hasn’t repurchased any of its shares in fy17 or year-to-date should perhaps tell you something about how appealing Copart stock is at 34x trailing earnings 🙂 A formidable scale-based competitive advantage supported by a responsible expansion plan has produced enviable returns on capital: EBITDA (no add-backs, no bullshit) has increased by $255mn over the last 7 years through fy17 on incremental gross capital of $845mn; pre-tax returns on gross capital have averaged around ~24% since fy11 with modest variation.
“I’m not going to have that discussion. It’s not Copart’s style. I wouldn’t do it. In a situation like this where an area has been so negatively impacted…So in this kind of situation, these major carriers are doing everything in the world they can to service their client base. I have to do everything I can to service them. I just don’t think it’s appropriate to even think of hitting them with trying to make a profit on this. I could not hit them with a price increase, I couldn’t do it.”
Does this answer give me the fuzzies? Naturally. I admit, I’m a sucker for this kind of stuff. But treating your customer well in hard times also happens to be sound long-term business (obviously). Before departing, I thought it might be helpful to put Copart side-by-side with IAA, as the gaping valuation disparity between Copart and KAR Auction Services – 21x EV/EBITDA for Copart vs. 11x (EV+capitalized rent)/EBITDAR for KAR, which, unlike Copart, predominantly leases rather than owns its facilities – seems interesting given IAA’s impending spin. Here is a high level view of Copart’s financials vs. IAA:
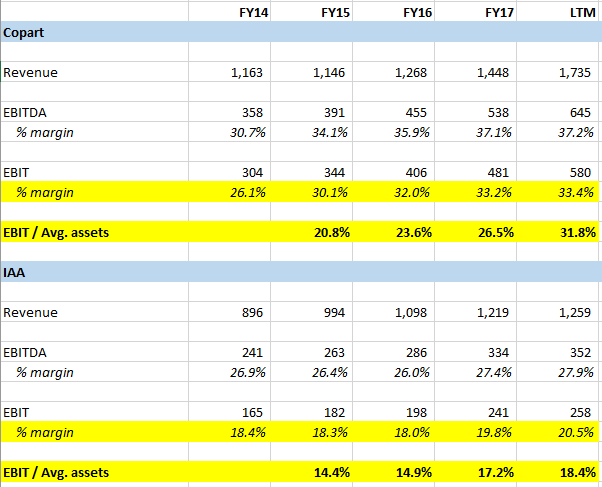
There are several important caveats. First, Copart and KAR have different fiscal year ends and I was too lazy to align their numbers. Doesn’t matter. The point is that Copart generates higher pre-tax returns than IAA on a similar revenue base [you can go back to FY16 when Copart generated the same amount of revenue as KAR does today and see that Copart’s returns were still higher].
Second, as I previously alluded to, IAA mostly leases its facilities while Copart mostly owns. KAR’s management claims that its rent expense comes to around 12% of revenue, which would account for all the margin differential, but can this be right? KAR’s total lease expense in 2017 was ~$164mn, which is indeed around 12%/13% of IAA’s revenue, but of course KAR is much bigger than IAA and includes a whole car auction segment, ADESA, which accounts for ~1/2 of KAR’s revenue and segment EBITDA. Surely some of KAR’s lease expense should be allocated to ADESA (or AFC, the company’s floorplan financing segment). But, let’s just say that rent is around 6% of IAA’s revenue. Even if we add those 6 points to IAA’s margins and generously make no reconciling adjustment to assets, IAA’s pre-tax ROA still falls short of Copart’s. Moreover, IAA’s margins don’t include any allocation of KAR’s corporate overhead, which is meaningful at around 15% of total segment-level EBITDA. Also, in the above table, I included all of KAR’s EBITDA add-backs except for stock comp and did not do likewise for Copart (in fact, refreshingly, Copart’s management doesn’t even disclose an Adjusted EBITDA figure). Finally, compared to IAA, Copart has a much higher mix of international business, which (for now) generates only ~15% ROA vs. 30%+ in the US, so comparing IAA to Copart USA only exacerbates the returns disparity. So, there does appear to be some kind of structural advantage or operational discipline in play at Copart that is lacking at IAA.
I thought maybe IAA’s cost structure included temporary cost bloat from acquired companies, but that doesn’t appear to be the case, as nearly all recent acquisitions and most of KAR’s goodwill is related to ADESA. We’ll get more clarity on what IAA looks like as an independent entity when the Form 10 comes out, but for now when I allocate corporate overhead according to revenue, I get around $300mn in EBITDA. This doesn’t deserve to trade at Copart’s 23x multiple (heck, that multiple isn’t exactly cheap for CPRT), but nor does KAR’s 10x multiple seem entirely fair.
Footnotes (1) vs. 17mn new cars that enter the fleet every year.